





What does an ad spend pacing dashboard show in Metabase?
An ad spend pacing dashboard shows whether budget is burning at the planned rate — before the month ends and the answer stops mattering. It joins daily spend from Google Ads, Meta Ads, LinkedIn Ads, and TikTok Ads against a budgets table, so over- and underspend surface by channel and campaign while there's still time to act.
For: performance marketers, marketing ops, and finance partners.Grain: one row per campaign per day per channel, joined to monthly budgets per channel and campaign.
What does an ad spend pacing dashboard look like?
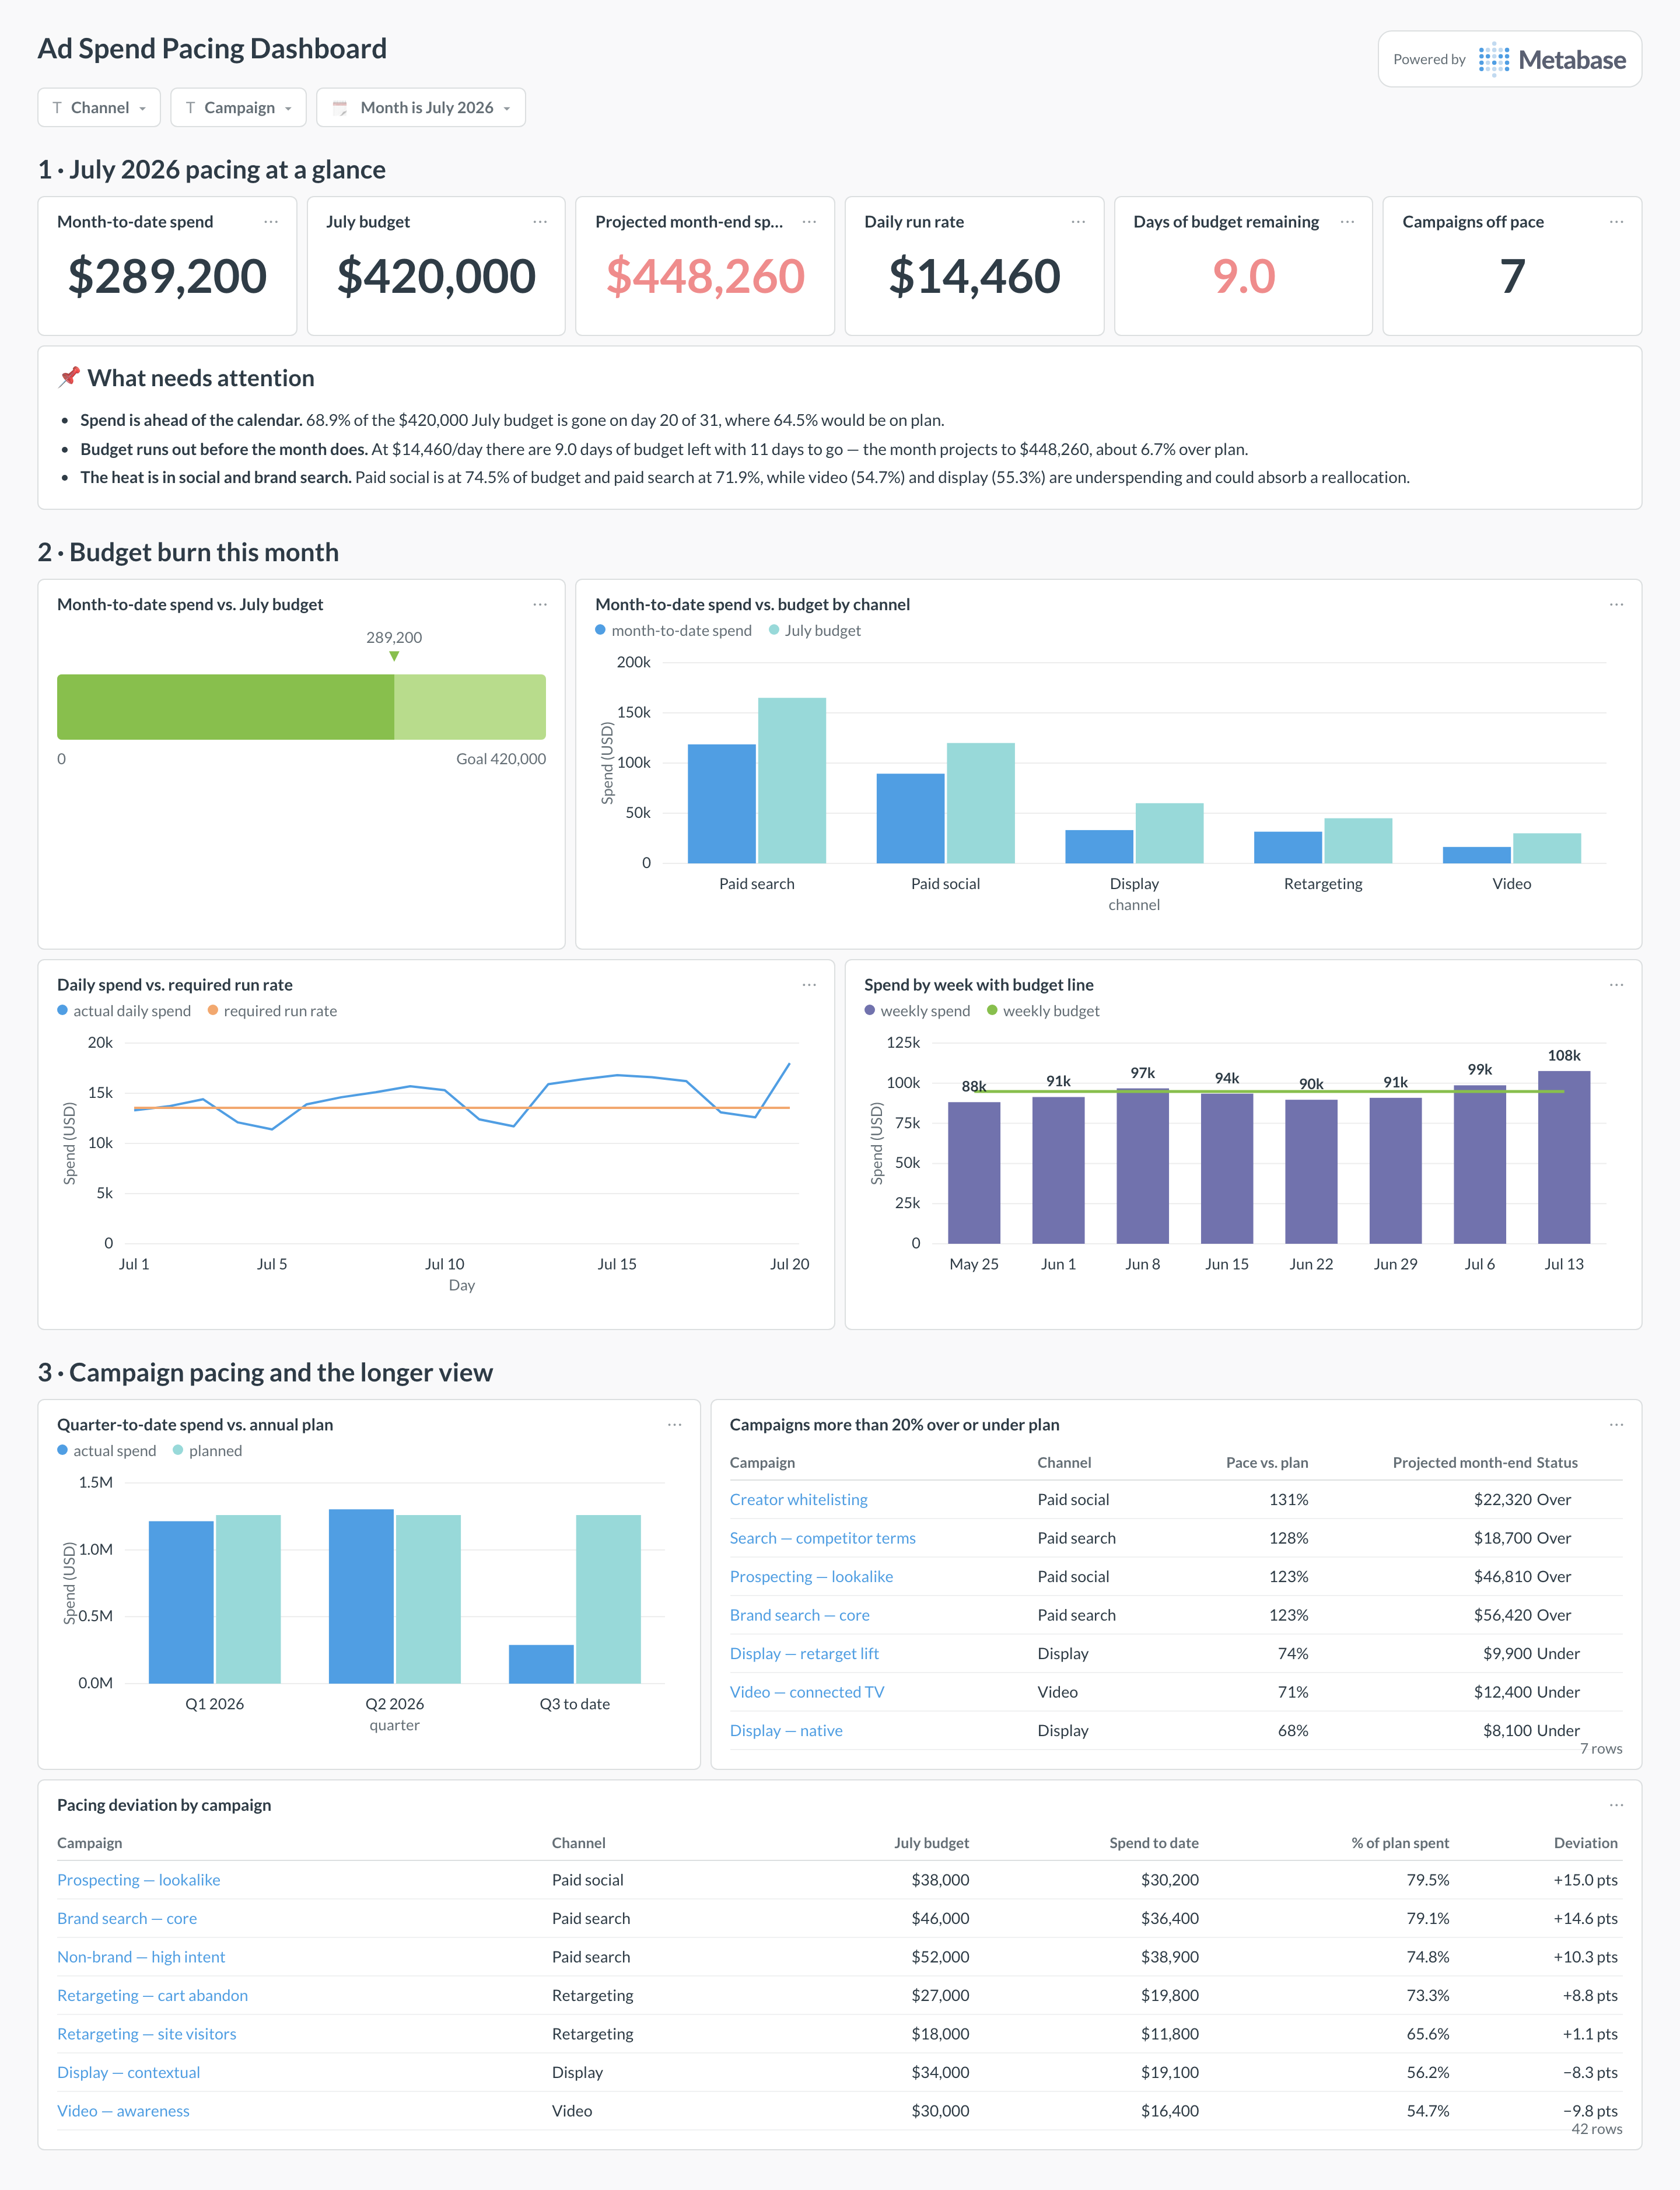
Here's the layout this guide builds, read mid-month rather than at month-end: budget burn and the projection at the top, then the run-rate and weekly spend charts that explain it, then the campaign tables that say which line items to turn up or down.
Which cards belong on an ad spend pacing dashboard?
- Month-to-date spend vs. budget by channel (progress or bar)
- Daily spend run rate vs. required run rate (line)
- Projected end-of-month spend vs. plan (number)
- Pacing deviation by campaign (table)
- Campaigns over or under 20% of plan (table)
- Days of budget remaining at the current rate (number)
- Spend by week with budget line (combo)
- Quarter-to-date vs. annual plan (bar)
What data does the dashboard need?
ad_performance_daily— the unioned per-channel spend model, one row per campaign per day (the same model behind the paid channel performance dashboard).budgetswith channel, campaign, month, and planned amount — usually maintained as a spreadsheet upload or a small warehouse table.- Optional flight dates per campaign, so flighted budgets pace against their window instead of the calendar month.
How do you build it?
- Sync daily spend from each ad platform into the unioned
ad_performance_dailymodel. - Land the budget plan as a
budgetstable — CSV upload into Metabase or a warehouse table — and agree who updates it when plans change. - Join actuals to plan on channel, campaign, and month; compute month-to-date spend, required run rate, and the linear projection.
- Build the cards, then attach alerts to the breach questions so pacing problems arrive in Slack, not in the month-end review.
Example card SQL
Month-to-date spend vs. budget with end-of-month projectionPostgreSQL
WITH mtd AS (
  SELECT
    channel,
    SUM(spend) AS mtd_spend
  FROM ad_performance_daily
  WHERE stat_date >= date_trunc('month', CURRENT_DATE)
  GROUP BY 1
),
channel_budgets AS (
  -- budgets are stored per campaign; roll them up to the channel grain first
  SELECT
    channel,
    SUM(planned_amount) AS budget
  FROM budgets
  WHERE month = date_trunc('month', CURRENT_DATE)
  GROUP BY 1
)
SELECT
  b.channel,
  b.budget,
  COALESCE(m.mtd_spend, 0) AS mtd_spend,
  ROUND(
    COALESCE(m.mtd_spend, 0)
      / EXTRACT(DAY FROM CURRENT_DATE)
      * EXTRACT(DAY FROM date_trunc('month', CURRENT_DATE)
        + INTERVAL '1 month - 1 day'),
    2
  ) AS projected_month_end,
  ROUND(
    COALESCE(m.mtd_spend, 0) / NULLIF(b.budget, 0) * 100, 1
  ) AS pct_of_budget_spent
FROM channel_budgets b
LEFT JOIN mtd m ON m.channel = b.channel
ORDER BY pct_of_budget_spent DESC;
Related
Metrics
Integrations
Dashboards
FAQ
What is an ad spend pacing dashboard?
An ad spend pacing dashboard is a governed view of budget burn against plan — how much has been spent month to date, how fast it's being spent, and where the month will land at the current rate. It joins actual spend from Google Ads, Meta Ads, LinkedIn Ads, and TikTok Ads to a budgets table, so overspend gets caught mid-month instead of on the invoice. It answers "are we on plan?" — the paid channel performance dashboard answers "is the spend working?".
Where does the budget table come from?
Almost always a spreadsheet — budgets are set in planning meetings, not in ad platforms. Keep one table with
channel, campaign, month, and planned_amount, and land it in the warehouse however fits: a dbt seed, a scheduled load, or a CSV upload straight into Metabase (upload works through the UI and the Metabase CLI). What matters is that it lives next to ad_performance_daily so the join is one query, and that someone owns updating it when plans change.How do you project end-of-month spend?
Linear extrapolation covers most cases: month-to-date spend, divided by days elapsed, multiplied by days in the month — that's what the example SQL does. It assumes spend is roughly even across the month, which holds for always-on campaigns. If spend ramps predictably (weekday-heavy B2B, end-of-quarter pushes), project from the trailing 7-day daily average instead of the full-month average; it reacts faster to rate changes you just made.
How does pacing work for always-on vs. flighted campaigns?
Always-on campaigns pace against calendar days: by day 15 of a 30-day month, roughly 50% of budget should be gone, and deviation from that line is the signal. Flighted campaigns — a two-week launch burst, a seasonal push — pace against the flight window, not the month, so store flight start and end dates in the budgets table and compute expected spend from days into the flight. Mixing the two on one calendar-based card makes every flighted campaign look like a pacing breach.
Can Metabase alert when pacing breaks?
Yes — Metabase alerts attach to saved questions. Build a question like "campaigns more than 20% over plan" and set an alert to fire when it returns rows; it lands in email or Slack without anyone opening the dashboard. Pair a breach alert (over-pacing) with an underspend alert, since money quietly not being spent is the failure mode nobody reports. Alerting on pacing and reviewing ROAS weekly is the core operating loop of marketing analytics for paid teams.