





What does a compliance posture dashboard show in Metabase?
A compliance posture dashboard shows whether you'd pass the audit today: control pass rates by framework, failing controls with owners and age, and the personnel checks auditors sample first. It's built from control test results synced from tools such as Vanta, Drata, and Okta.
For: compliance leads, security engineers, and CISOs reporting to the board. Grain: one row per control test per day, snapshotted from the compliance platform.
What does a compliance posture dashboard look like?
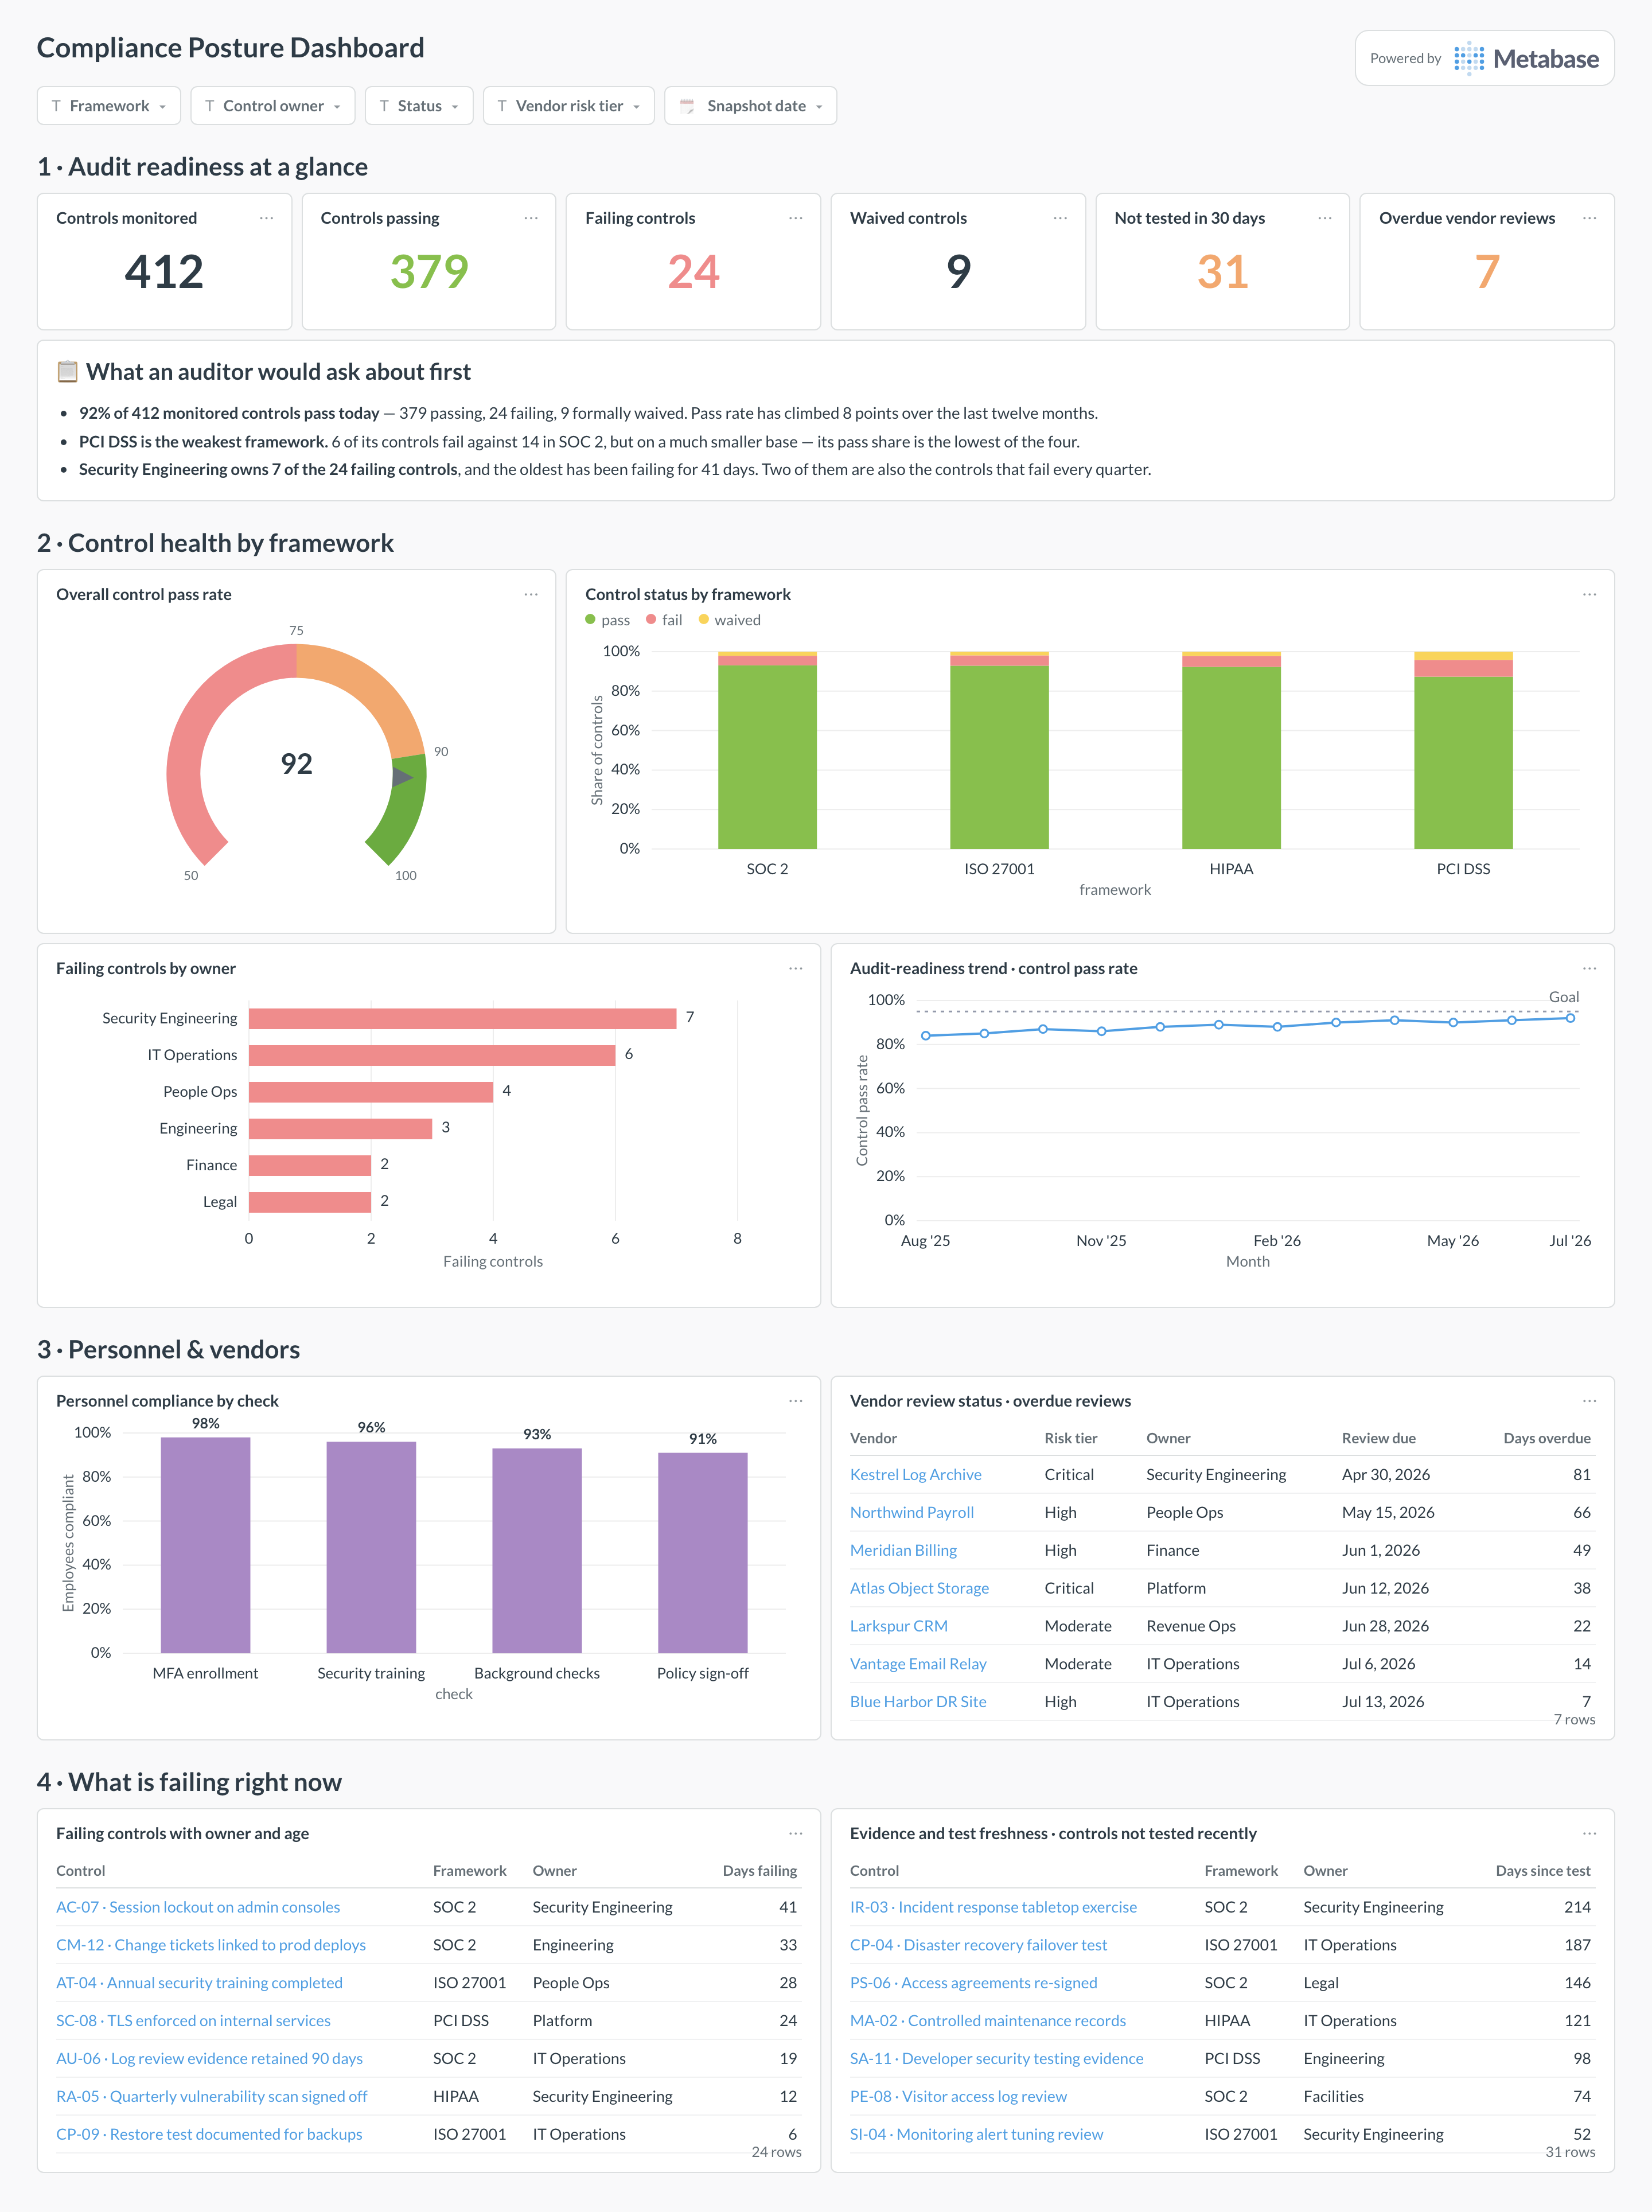
Here's the layout this guide builds, at the grain of one control test per day: the overall pass score and per-framework status at the top, then personnel and vendor checks, then the controls that are failing or stale right now. Read it before a board update, and again before an audit window opens.
Which cards belong on a compliance posture dashboard?
- Control pass rate by framework — SOC 2, ISO 27001, HIPAA (bar)
- Failing controls with owner and days failing (table)
- Evidence and test freshness — controls not tested recently (table)
- Personnel compliance — security training, MFA enrollment, background checks (bar)
- Vendor review status — overdue reviews (table)
- Audit-readiness trend — pass rate over time (line)
What data does the dashboard need?
control_results— one row per control test per day, with framework, status, and owner.personnel_compliance— per-person training, MFA, and background-check status.vendors— vendor list with review dates and risk tier.
How do you build it?
- Snapshot control results from the compliance platform's API daily — the platform shows current state, the snapshots give you history.
- Keep one row per control with a mapping table to framework requirements, so one fix moves every framework's number.
- Join personnel checks to the HR roster so the denominator is current employees, not every account ever created.
- Build the per-framework pass-rate bar and failing-controls table first; add freshness, vendor, and trend cards next.
Example card SQL
Control pass rate by framework from latest test resultsPostgreSQL
WITH latest AS (
  SELECT DISTINCT ON (framework, control_id)
    framework,
    control_id,
    status
  FROM control_results
  ORDER BY framework, control_id, tested_at DESC
)
SELECT
  framework,
  COUNT(*) AS controls,
  COUNT(*) FILTER (WHERE status = 'pass') AS passing,
  ROUND(
    100.0 * COUNT(*) FILTER (WHERE status = 'pass')
      / NULLIF(COUNT(*), 0), 1
  ) AS pass_rate_pct
FROM latest
GROUP BY framework
ORDER BY pass_rate_pct ASC;
Related
Metrics
Integrations
Dashboards
FAQ
What is a compliance posture dashboard?
A compliance posture dashboard shows whether you'd pass the audit today and whether that answer is improving: control pass rate by framework, failing controls with named owners and age, and the personnel checks — training, MFA, background checks — that audits always sample. It's built from control test results synced from Vanta or Drata, and it turns audit readiness from a scramble into a trend line within your security analytics stack.
Why snapshot compliance data daily instead of reading current state?
Compliance platforms report current state — which controls pass right now — and most keep little queryable history. Snapshot the control results into
control_results daily (one row per control test per day) and you get what the platform can't show: pass-rate trend across quarters, how long each control has been failing, and whether posture degrades between audits. The caveat: history starts the day you start snapshotting, so begin well before you need the trend.How do you handle one control mapping to multiple frameworks?
Most controls satisfy requirements in several frameworks at once — one MFA control maps to SOC 2, ISO 27001, and HIPAA criteria. Keep the control as one row in your control catalog, with a mapping table from control to framework requirement, so a single fix updates every framework's pass rate and per-framework cards stay honest. This is why MFA adoption rate from Okta shows up in the personnel section: one underlying fact, several framework claims.
What does the board want to see from this dashboard?
Three things: the pass-rate trend per framework (are we audit-ready and trending up), the count and age of failing controls with owners (is anything rotting), and personnel compliance (training, MFA, background checks — the human layer auditors sample first). Pair it with the vulnerability management dashboard for the technical-risk half of the story, and the quarterly security update writes itself from live cards instead of screenshots.
How is this different from Vanta or Drata's own dashboard?
The compliance platform's dashboard is the workspace for compliance managers: evidence collection, test details, auditor exports. This one answers cross-system questions the platform can't: control results joined with HR data for personnel views, with Okta sign-in data for real failed-login and MFA numbers, and with your own snapshots for multi-quarter trends. Metabase reads these from your SQL warehouse — it doesn't connect to Vanta or Drata directly — so the sync job that lands their API data in the warehouse is the prerequisite.