




What goes in a digital marketing dashboard in Metabase?
A digital marketing dashboard puts every acquisition channel side by side — spend, leads, cost per conversion, and conversion rate — on one definition of a lead. It's built by syncing Google Ads, Meta Ads, Google Analytics, and your CRM into a database, so the comparison survives contact with the platforms' own conflicting reports.
For: demand gen, growth, and marketing leadership. Grain: one row per channel per day or month. Refresh: daily, with a restatement window for late-attributed conversions.
What does a digital marketing dashboard look like?
Here’s the layout this guide builds. The month’s headline numbers sit at the top, volume and channel mix in the middle, and efficiency plus on-site performance at the bottom — so a weekly review reads top to bottom and stops when it has its answer.
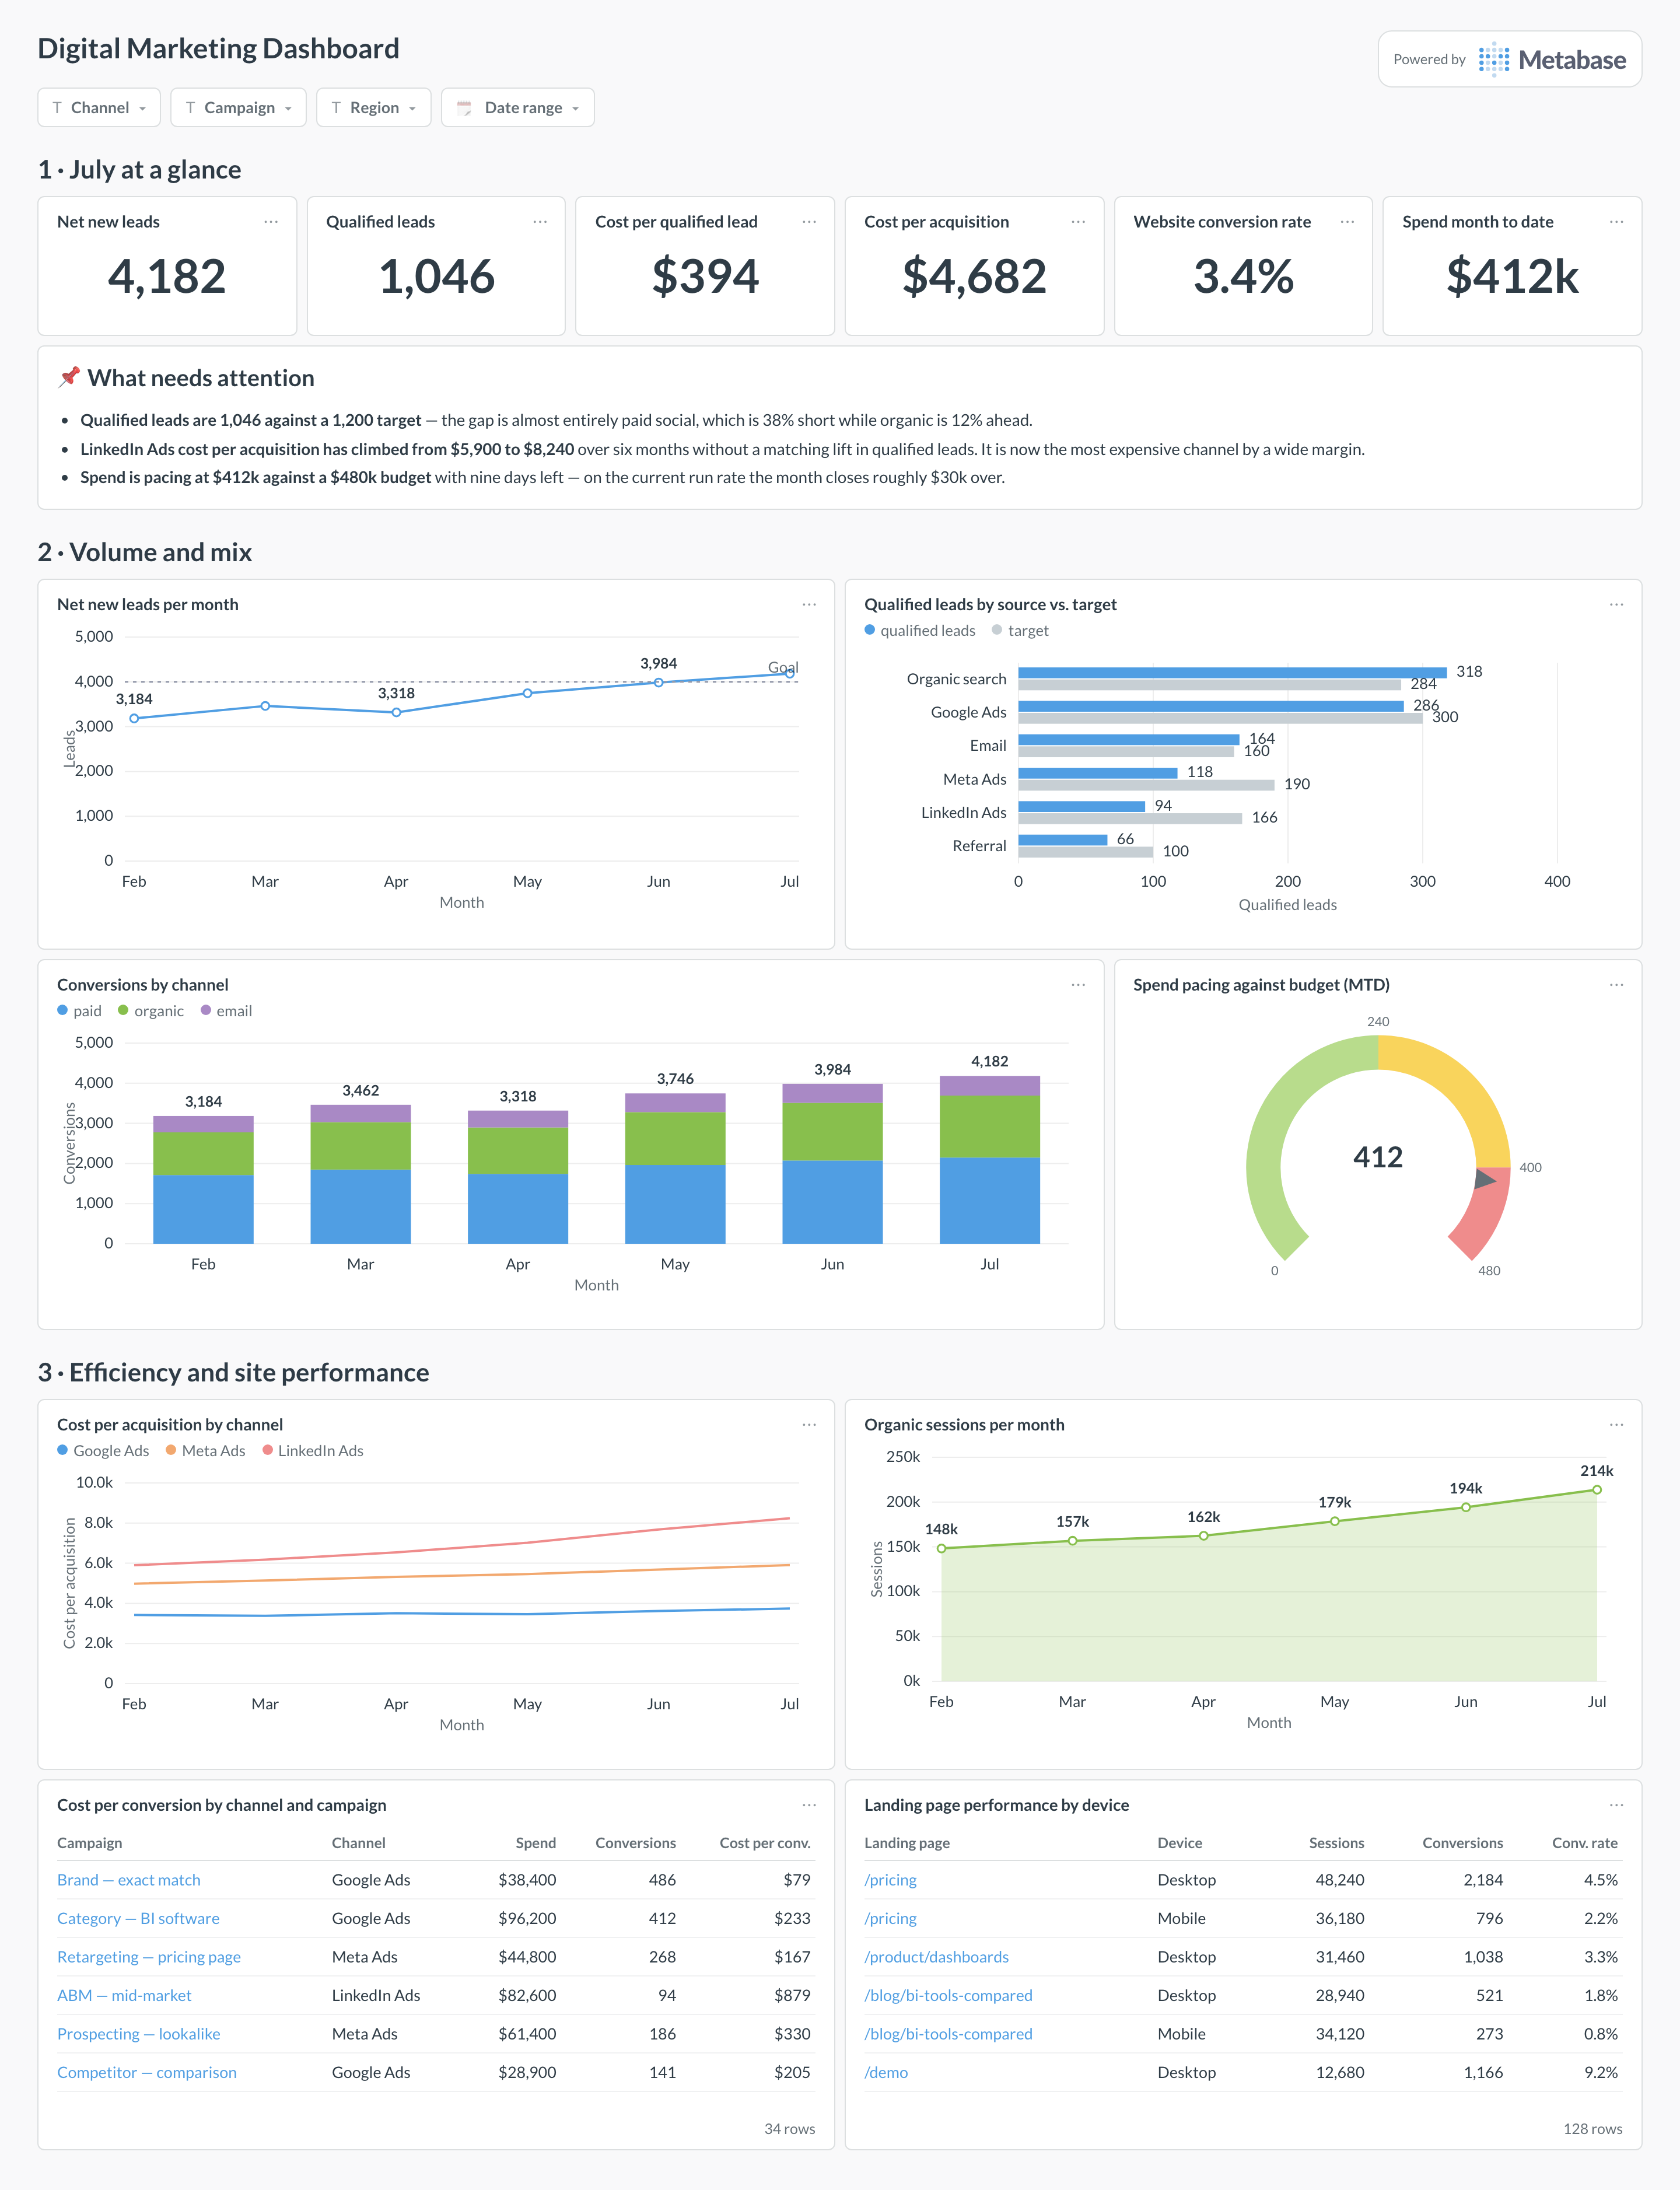
An example digital marketing dashboard in Metabase, built from Google Ads, Meta Ads, Google Analytics, and CRM data. Figures are illustrative.
Which cards belong on a digital marketing dashboard?
These eight are the standard set. Read the first row for volume, the second for efficiency, and the last for where the funnel is leaking.
- Net new leads per month, with trend (line + number)
- Qualified leads per month against target, by source (bar)
- Cost per conversion by channel and campaign (table)
- Cost per acquisition — spend divided by new customers, by channel (line)
- Conversions by channel, paid versus organic versus email (stacked bar)
- Organic traffic growth month over month (area)
- Website conversion rate by landing page and device (table)
- Spend pacing against budget, month to date (gauge)
What data does the dashboard need?
ad_spend_daily— one row per platform, campaign, and day, with cost, impressions, and clicks in a single currency.sessionsor page-level analytics with source, medium, campaign, device, and landing page.modeled_leads— one row per lead with created date, first- and last-touch channel, qualification flag, and the date it became a customer.- Search Console query and page data if you want organic performance beside paid.
- A
channel_mapthat folds messy UTM values into the handful of channels leadership actually recognizes.
How do you build it?
- Sync ad platforms, analytics, and the CRM into one database with a pipeline (see building a data pipeline), keeping raw campaign IDs and UTMs.
- Normalize channels once with a mapping table — nothing wrecks a marketing dashboard faster than
Paid Social,paid-social, andfbas three separate rows. - Define a qualified lead and an attribution model as certified models, and point every card at them.
- Build volume cards first, then efficiency cards on top of the same joins, so cost per lead can never disagree with lead count.
- Add filters for date range, channel, campaign, and region, and show the refresh timestamp plus the attribution model in use.
Example card SQL
WITH spend AS (
SELECT
  date_trunc('month', spend_date) AS month,
  channel,
  SUM(cost) AS cost
FROM ad_spend_daily
GROUP BY 1, 2
), leads AS (
SELECT
  date_trunc('month', created_at) AS month,
  first_touch_channel AS channel,
  COUNT(*)                                          AS new_leads,
  COUNT(*) FILTER (WHERE is_qualified)              AS qualified_leads,
  COUNT(*) FILTER (WHERE became_customer_at IS NOT NULL) AS customers
FROM modeled_leads
GROUP BY 1, 2
)
SELECT
COALESCE(s.month, l.month)     AS month,
COALESCE(s.channel, l.channel) AS channel,
l.new_leads,
l.qualified_leads,
s.cost,
ROUND(s.cost / NULLIF(l.qualified_leads, 0), 2) AS cost_per_qualified_lead,
ROUND(s.cost / NULLIF(l.customers, 0), 2)       AS cost_per_acquisition
FROM spend s
FULL OUTER JOIN leads l ON l.month = s.month AND l.channel = s.channel
ORDER BY month DESC, cost DESC NULLS LAST;