





What does a security incident response trends dashboard show in Metabase?
A security incident response trends dashboard shows how the SOC is performing over time: detections per week by severity and tactic, median time to detect and contain, and how much of the queue closes as benign. It's built from detection and incident records synced from tools such as CrowdStrike, SentinelOne, and Okta.
For: SOC leads, detection engineers, and CISOs. Grain: one row per detection, plus one row per confirmed security incident.
What does an incident response trends dashboard look like?
Here's the layout this guide builds, at the grain of a single detection: the queue's size and shape at the top, then volume by severity and tactic alongside detect and contain times, then the rules and hosts generating the most work. Read it monthly, when deciding which detections to tune.
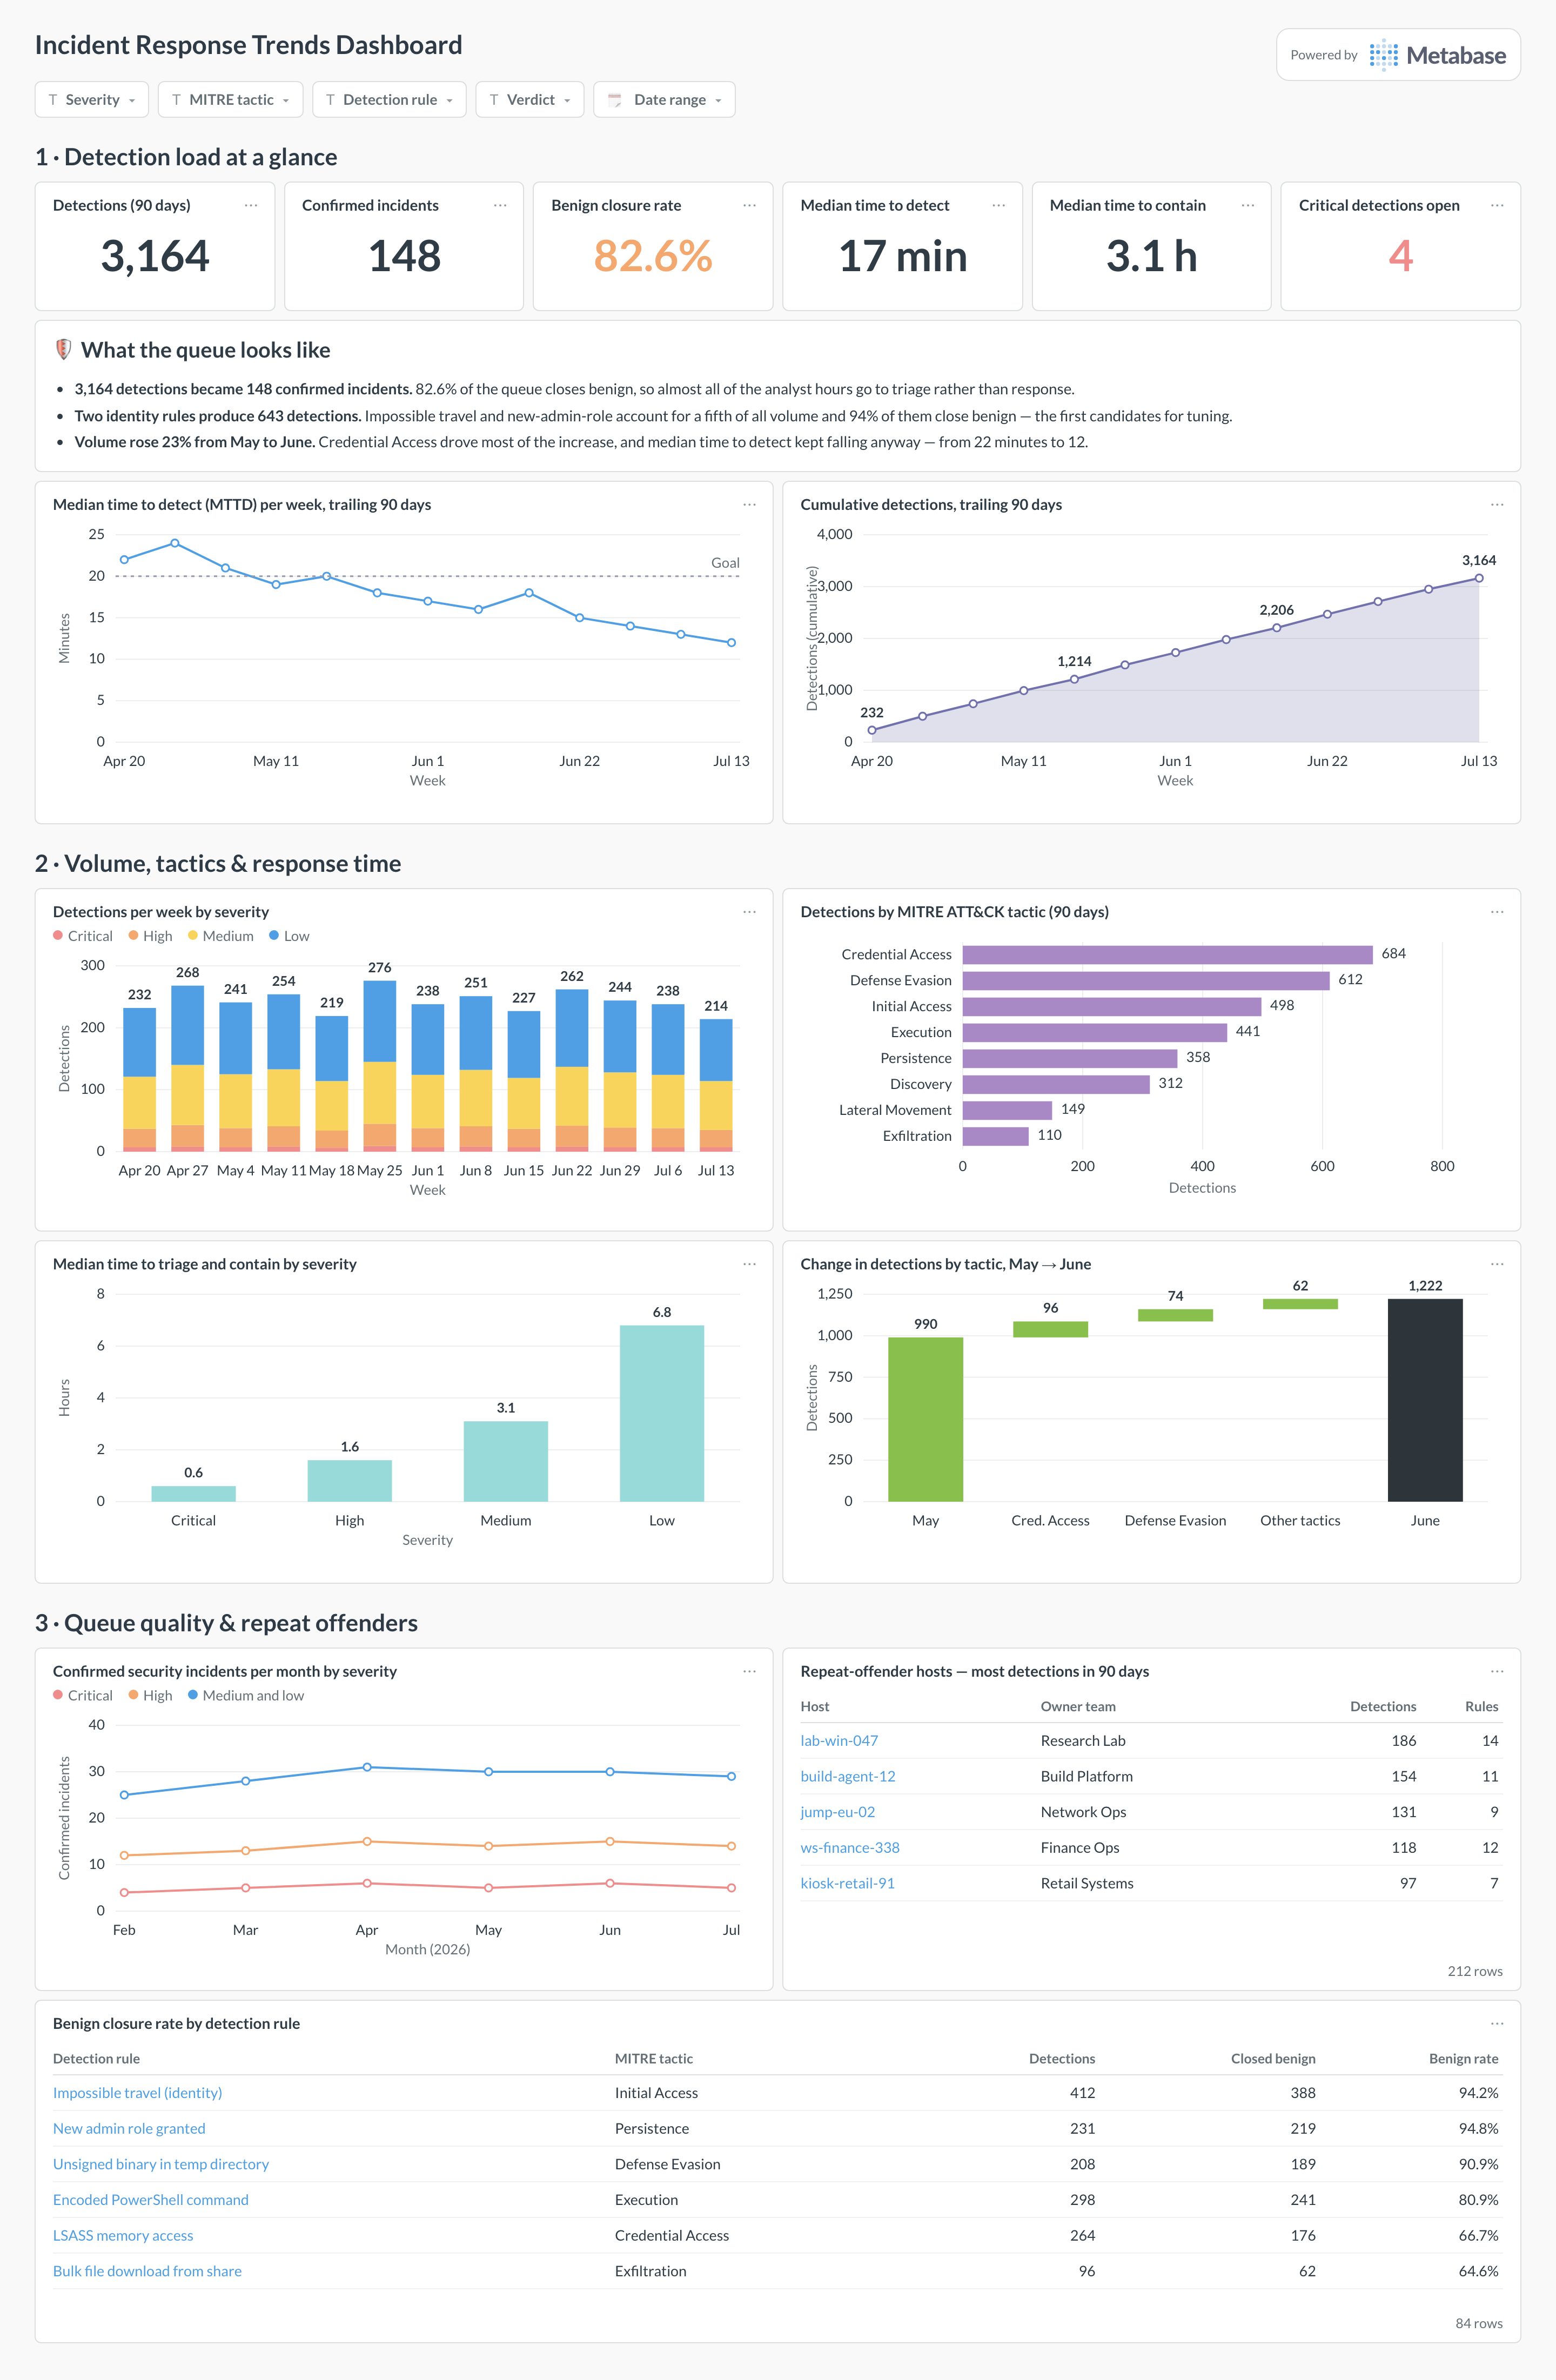
Which cards belong on an incident response trends dashboard?
- Detections per week by severity (stacked bar)
- Detections by MITRE ATT&CK tactic (bar)
- Median time to detect (MTTD), trailing 90 days (line)
- Median time to triage and contain by severity (bar)
- False-positive / benign closure rate by detection rule (table)
- Repeat-offender hosts — most detections in 90 days (table)
What data does the dashboard need?
detections— one row per detection withdetected_at,occurred_at,triaged_at,contained_at, verdict, severity, tactic, andhost_id.security_incidents— confirmed incidents with severity and resolution timestamps, linked to their originating detections.
How do you build it?
- Sync the detection grain from the EDR and identity providers — verdicts, timestamps, and tactics, not the raw telemetry firehose.
- Normalize severity and verdict values across sources so "benign," "false_positive," and "expected" roll up consistently.
- Compute response medians from timestamp deltas, excluding rows where the relevant timestamp is missing rather than treating them as zero.
- Build the weekly volume and triage-time cards first; add tactic breakdowns and repeat-offender views once verdicts are trustworthy.
Example card SQL
Weekly detection volume and median triage hours by severityPostgreSQL
SELECT
  DATE_TRUNC('week', detected_at) AS week,
  severity,
  COUNT(*) AS detections,
  ROUND(
    PERCENTILE_CONT(0.5) WITHIN GROUP (
      ORDER BY EXTRACT(EPOCH FROM (triaged_at - detected_at)) / 3600.0
    )::numeric, 1
  ) AS median_triage_hours
FROM detections
WHERE detected_at >= CURRENT_DATE - INTERVAL '12 weeks'
  AND triaged_at IS NOT NULL
GROUP BY week, severity
ORDER BY week, severity;
Related
Metrics
Integrations
Dashboards
FAQ
What is a security incident response trends dashboard?
It's the SOC's trend view: detection volume per week by severity and MITRE ATT&CK tactic, median time to detect, triage, and contain, and how much of the queue turns out to be benign. Where the EDR console shows the queue right now, this dashboard shows whether the operation is getting faster quarter over quarter — the MTTD and incident count trends a CISO actually presents. It's a core piece of a security analytics practice.
How is this different from the incident response dashboard?
The incident response dashboard is IT-ops incident management: pages, on-call load, MTTA/MTTR for outages. This one is the security-detection view — verdicts, ATT&CK tactics, containment times from CrowdStrike or SentinelOne. The two share shapes (both count events and measure response medians) but different sources and audiences: one reports to the VP of Engineering, this one to the CISO. Keep them separate and link them where a detection escalates into an operational incident.
How do you measure MTTD honestly?
True MTTD is
detected_at − occurred_at, but occurred_at is often unknowable — you rarely learn exactly when the attacker first acted. Use the earliest observed activity timestamp the EDR attaches to the detection as the proxy, label the card accordingly, and treat detections with no activity timestamp as excluded rather than zero. An honest median with a stated caveat beats a precise-looking number computed from a field that's really "when the sensor noticed."Why track the false-positive rate?
The benign-closure rate is SOC hygiene: the share of detections closed as false positive or expected activity. When it climbs, analysts burn hours on noise and real alerts wait longer in the queue — the same failure mode the alert quality dashboard tracks for paging, measured here with alert noise rate. Trend it by detection rule so tuning effort goes to the rules generating the noise, not spread evenly across everything.
Do you sync raw EDR telemetry into the warehouse for this?
No — the raw telemetry firehose (process events, network connections) is petabyte-scale and belongs in the EDR platform. Sync only the detection and incident grain: one row per detection with timestamps, severity, tactic, verdict, and host. That's a few thousand rows a week, cheap in any warehouse (Metabase reads SQL databases and warehouses, not the SaaS tools directly), and enough for every card on this dashboard. Threat hunting over raw events stays in the vendor console; trend reporting lives here.