





What does an SLO tracking dashboard show in Metabase?
An SLO tracking dashboard shows reliability against explicit, published targets: how much error budget each service has left, how fast it's burning, and where the breaches are. It's built from SLO definitions and rollups synced from tools such as Honeycomb, Datadog, Prometheus, and Grafana.
For: SREs, service owners, and engineering leadership. Grain: one row per SLO per day, plus the SLO definitions themselves.
What does an SLO tracking dashboard look like?
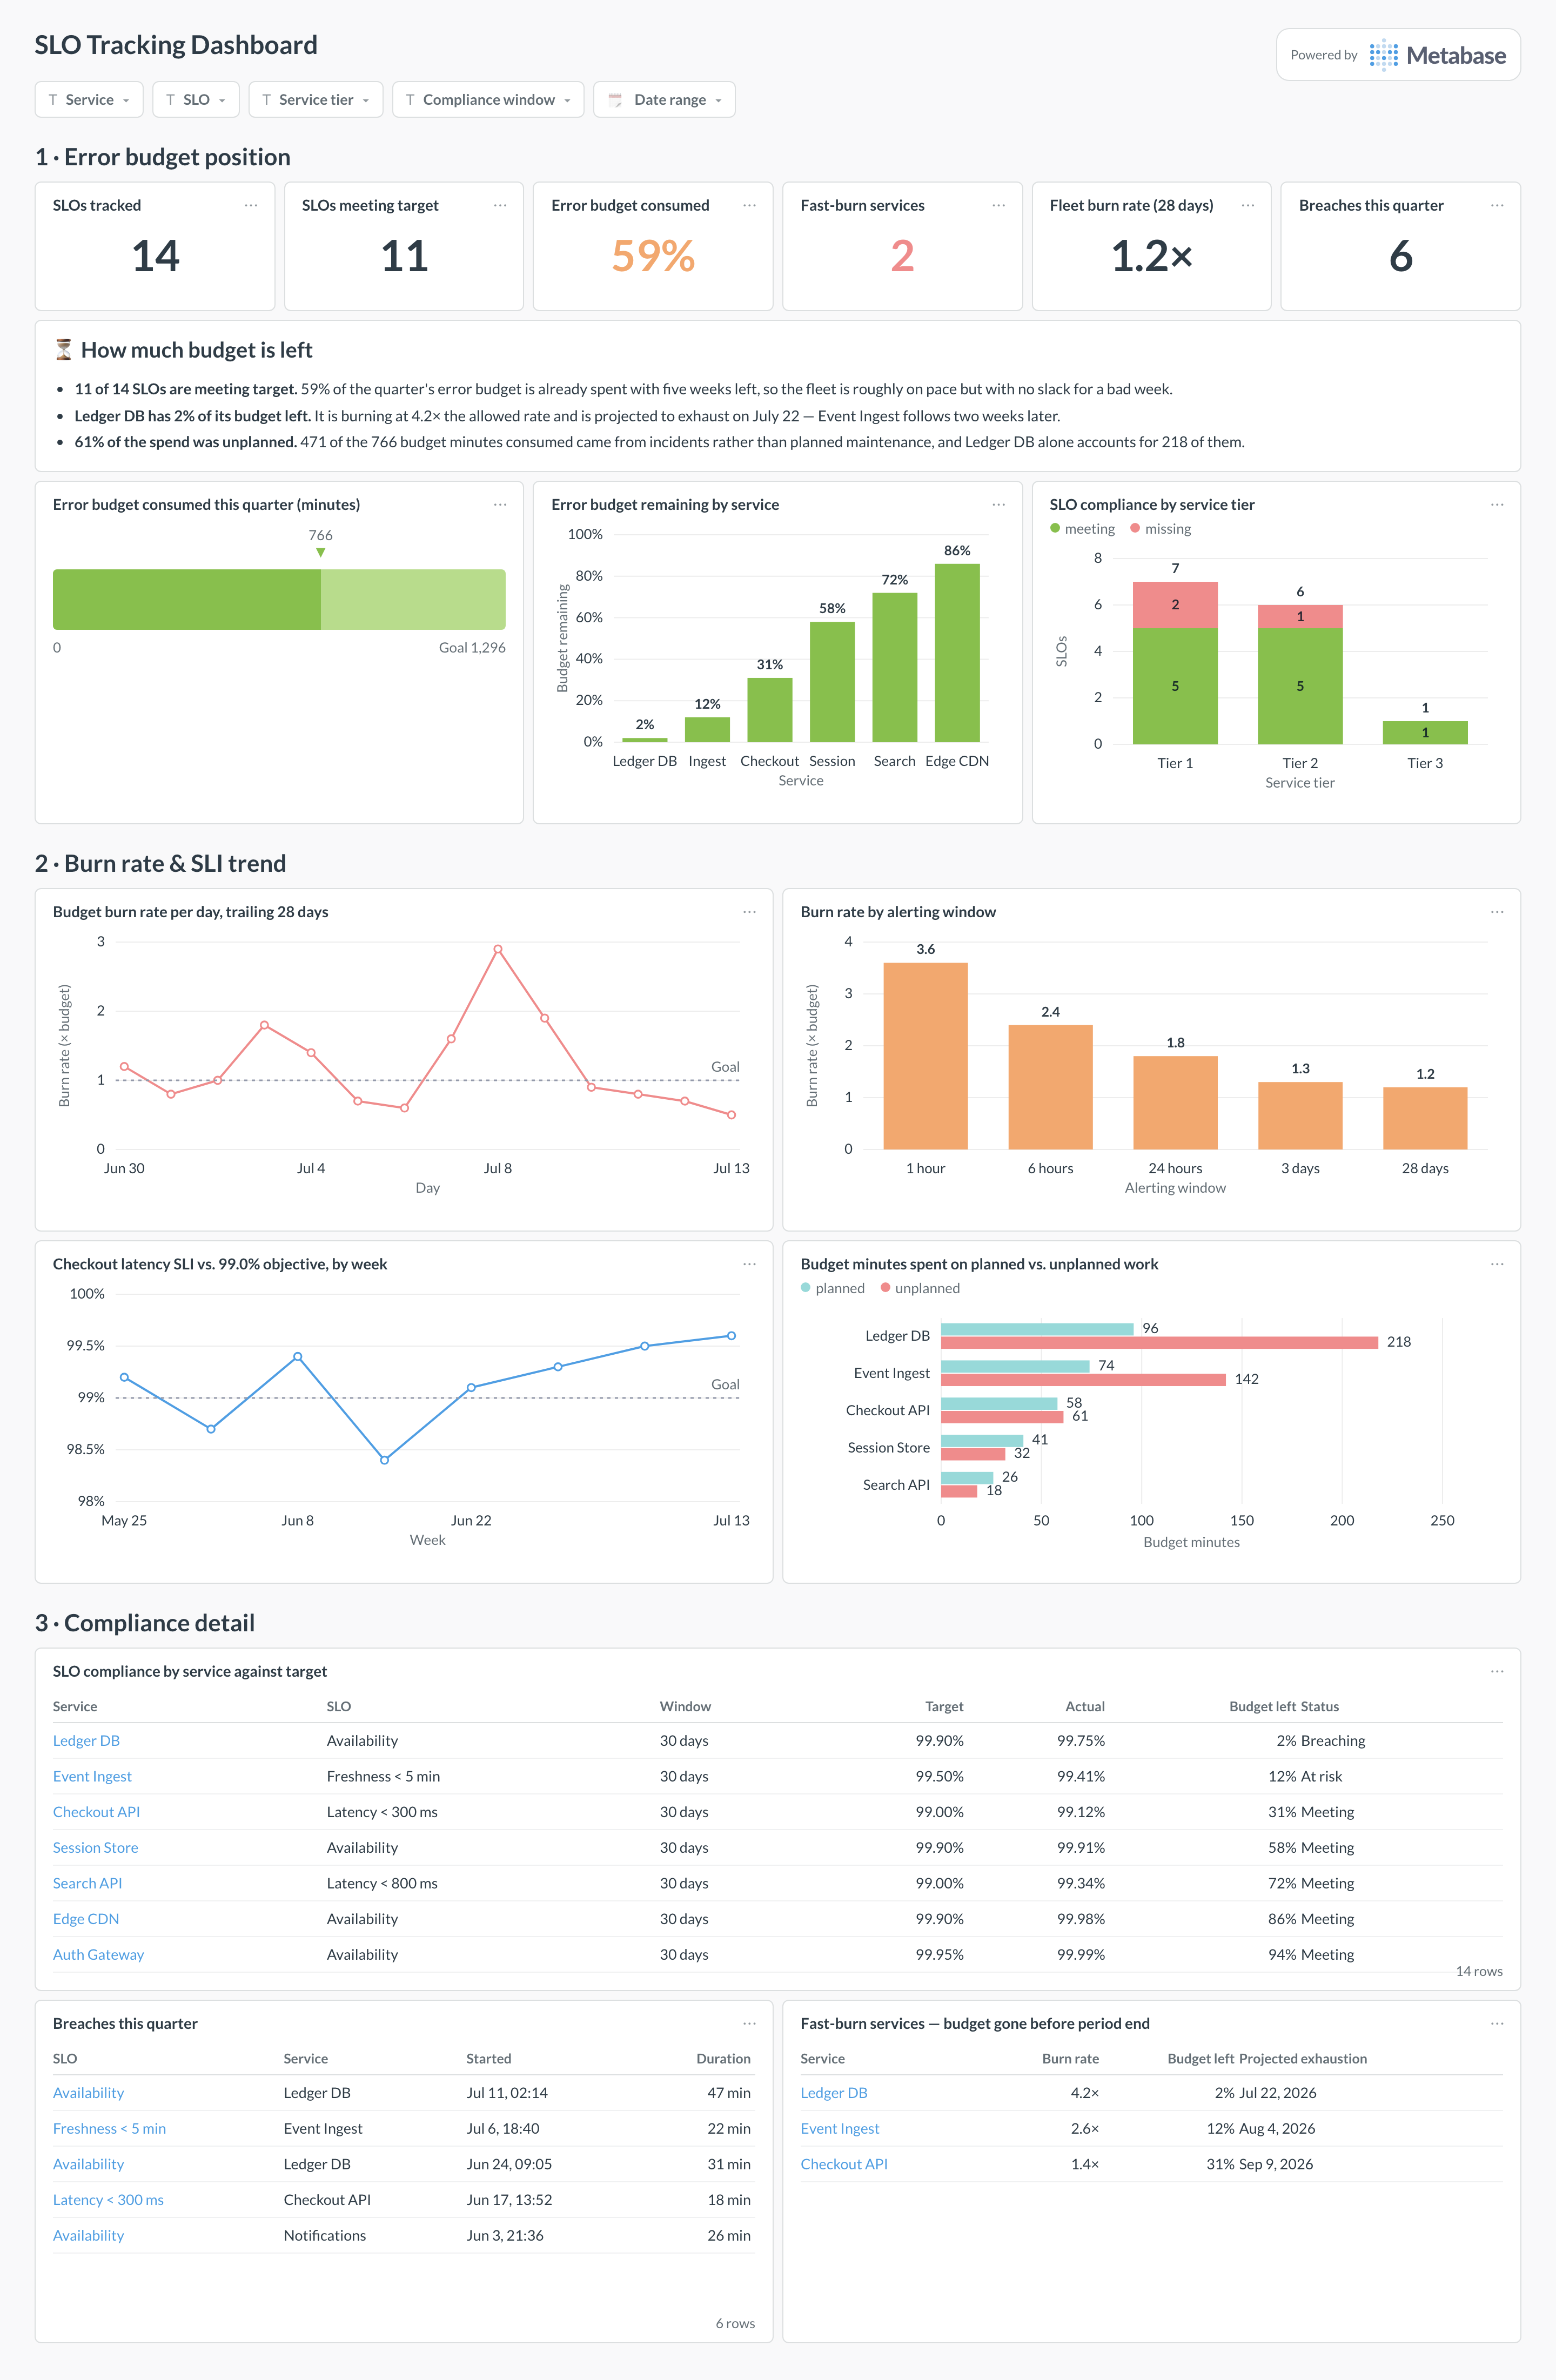
Here's the layout this guide builds, at the grain of one SLO per day: how much error budget is left and where, then burn rate and the SLI against its objective, then the compliance, breach and fast-burn tables. Read it when deciding whether to ship or to spend the week on reliability work.
Which cards belong on an SLO tracking dashboard?
- Error budget remaining by service (bar)
- Budget burn rate, trailing 28 days (line)
- SLO compliance by service vs. target (table)
- Breaches this quarter with dates and duration (table)
- Fast-burn services — budget gone before period end (table)
- Compliance by service tier (bar)
- Budget spent on planned vs. unplanned work where tracked
What data does the dashboard need?
slo_definitions— service, objective (target percentage), window, and indicator type.service_health_rollups(or the source tool's SLO status API results) — daily good/total counts per SLO.- Optional
incidentsto attribute budget burn to specific events.
How do you build it?
- Publish the targets first — an SLO dashboard without agreed objectives is just an availability chart.
- Sync daily SLO status from the source (most tools expose budget and burn via API) or compute it from good/total rollups.
- Compute budget consumed as (1 − actual) ÷ (1 − target) so 100% means the budget is gone.
- Build the budget-remaining bar and fast-burn table first; add breach history and tier views next.
Example card SQL
Error budget consumed by service, trailing 28 daysPostgreSQL
WITH actuals AS (
  SELECT
    service_name,
    slo_target,
    100.0 * SUM(successful_requests) / NULLIF(SUM(total_requests), 0)
      AS actual_pct
  FROM service_health_rollups
  WHERE window_start >= CURRENT_DATE - INTERVAL '28 days'
  GROUP BY service_name, slo_target
)
SELECT
  service_name,
  slo_target,
  ROUND(actual_pct, 3) AS actual_pct,
  ROUND(
    100.0 * (100.0 - actual_pct) / NULLIF(100.0 - slo_target, 0), 1
  ) AS error_budget_consumed_pct
FROM actuals
ORDER BY error_budget_consumed_pct DESC;
Related
Metrics
Integrations
Dashboards
FAQ
What is an SLO tracking dashboard?
An SLO tracking dashboard reports reliability against explicit, published targets: how much error budget each service has left, how fast it's burning, and which SLOs breached this quarter. It sits a level above a service availability dashboard — same underlying rollups, but every number is judged against a target, so SLO compliance becomes a shared fact rather than a per-tool readout in Datadog or Grafana.
What data do you need to track SLOs in Metabase?
Two tables carry the dashboard:
slo_definitions — service, objective, window, and indicator type — and daily good/total counts per SLO, either from a service_health_rollups table or from the SLO status APIs that Honeycomb, Datadog, and Grafana expose. Add an optional incidents table to attribute budget burn to specific events. If you already compute availability from Prometheus rollups, the same data works here.What's the difference between SLO compliance and availability?
Availability is the measurement; the SLO is the promise. Service availability tells you a service ran at 99.2% — SLO compliance judges that number against an explicit target with an error budget, which turns "99.2%" into "fine" or "breach." The same logic applies to latency and freshness SLOs. Without published targets, an SLO dashboard is just an availability chart with extra steps.
Why track burn rate and not just the budget?
Budget remaining tells you where you are; burn rate tells you where you'll be. A service at 60% budget burning 5% a day breaches in a week — the burn-rate card is the early warning that lets a team slow releases or prioritize fixes before the breach, not after. Fast-burn windows also correlate with what the incident response dashboard shows: overlay incidents on burn to see which events actually spent the budget.
How do you calculate an error budget?
The error budget is the allowed unreliability: for a 99.9% target over 28 days, the budget is 0.1% of requests (or about 40 minutes). Compute budget consumed as (1 − actual) ÷ (1 − target), so 100% means the budget is gone — the example SQL on this page does exactly that from
service_health_rollups. Track consumption as the trend and pair it with SLO compliance and error rate for the full picture.