





What goes in a vendor spend dashboard?
A vendor spend dashboard combines card transactions, bills, reimbursements, purchase orders, and ledger actuals into one normalized vendor view. It should separate committed, authorized, cleared, and posted spend.
For: Finance operations, procurement, FP&A, and budget owners. Refresh: daily.Source: modeled finance tables in a Metabase-connected database.
What does this dashboard look like?
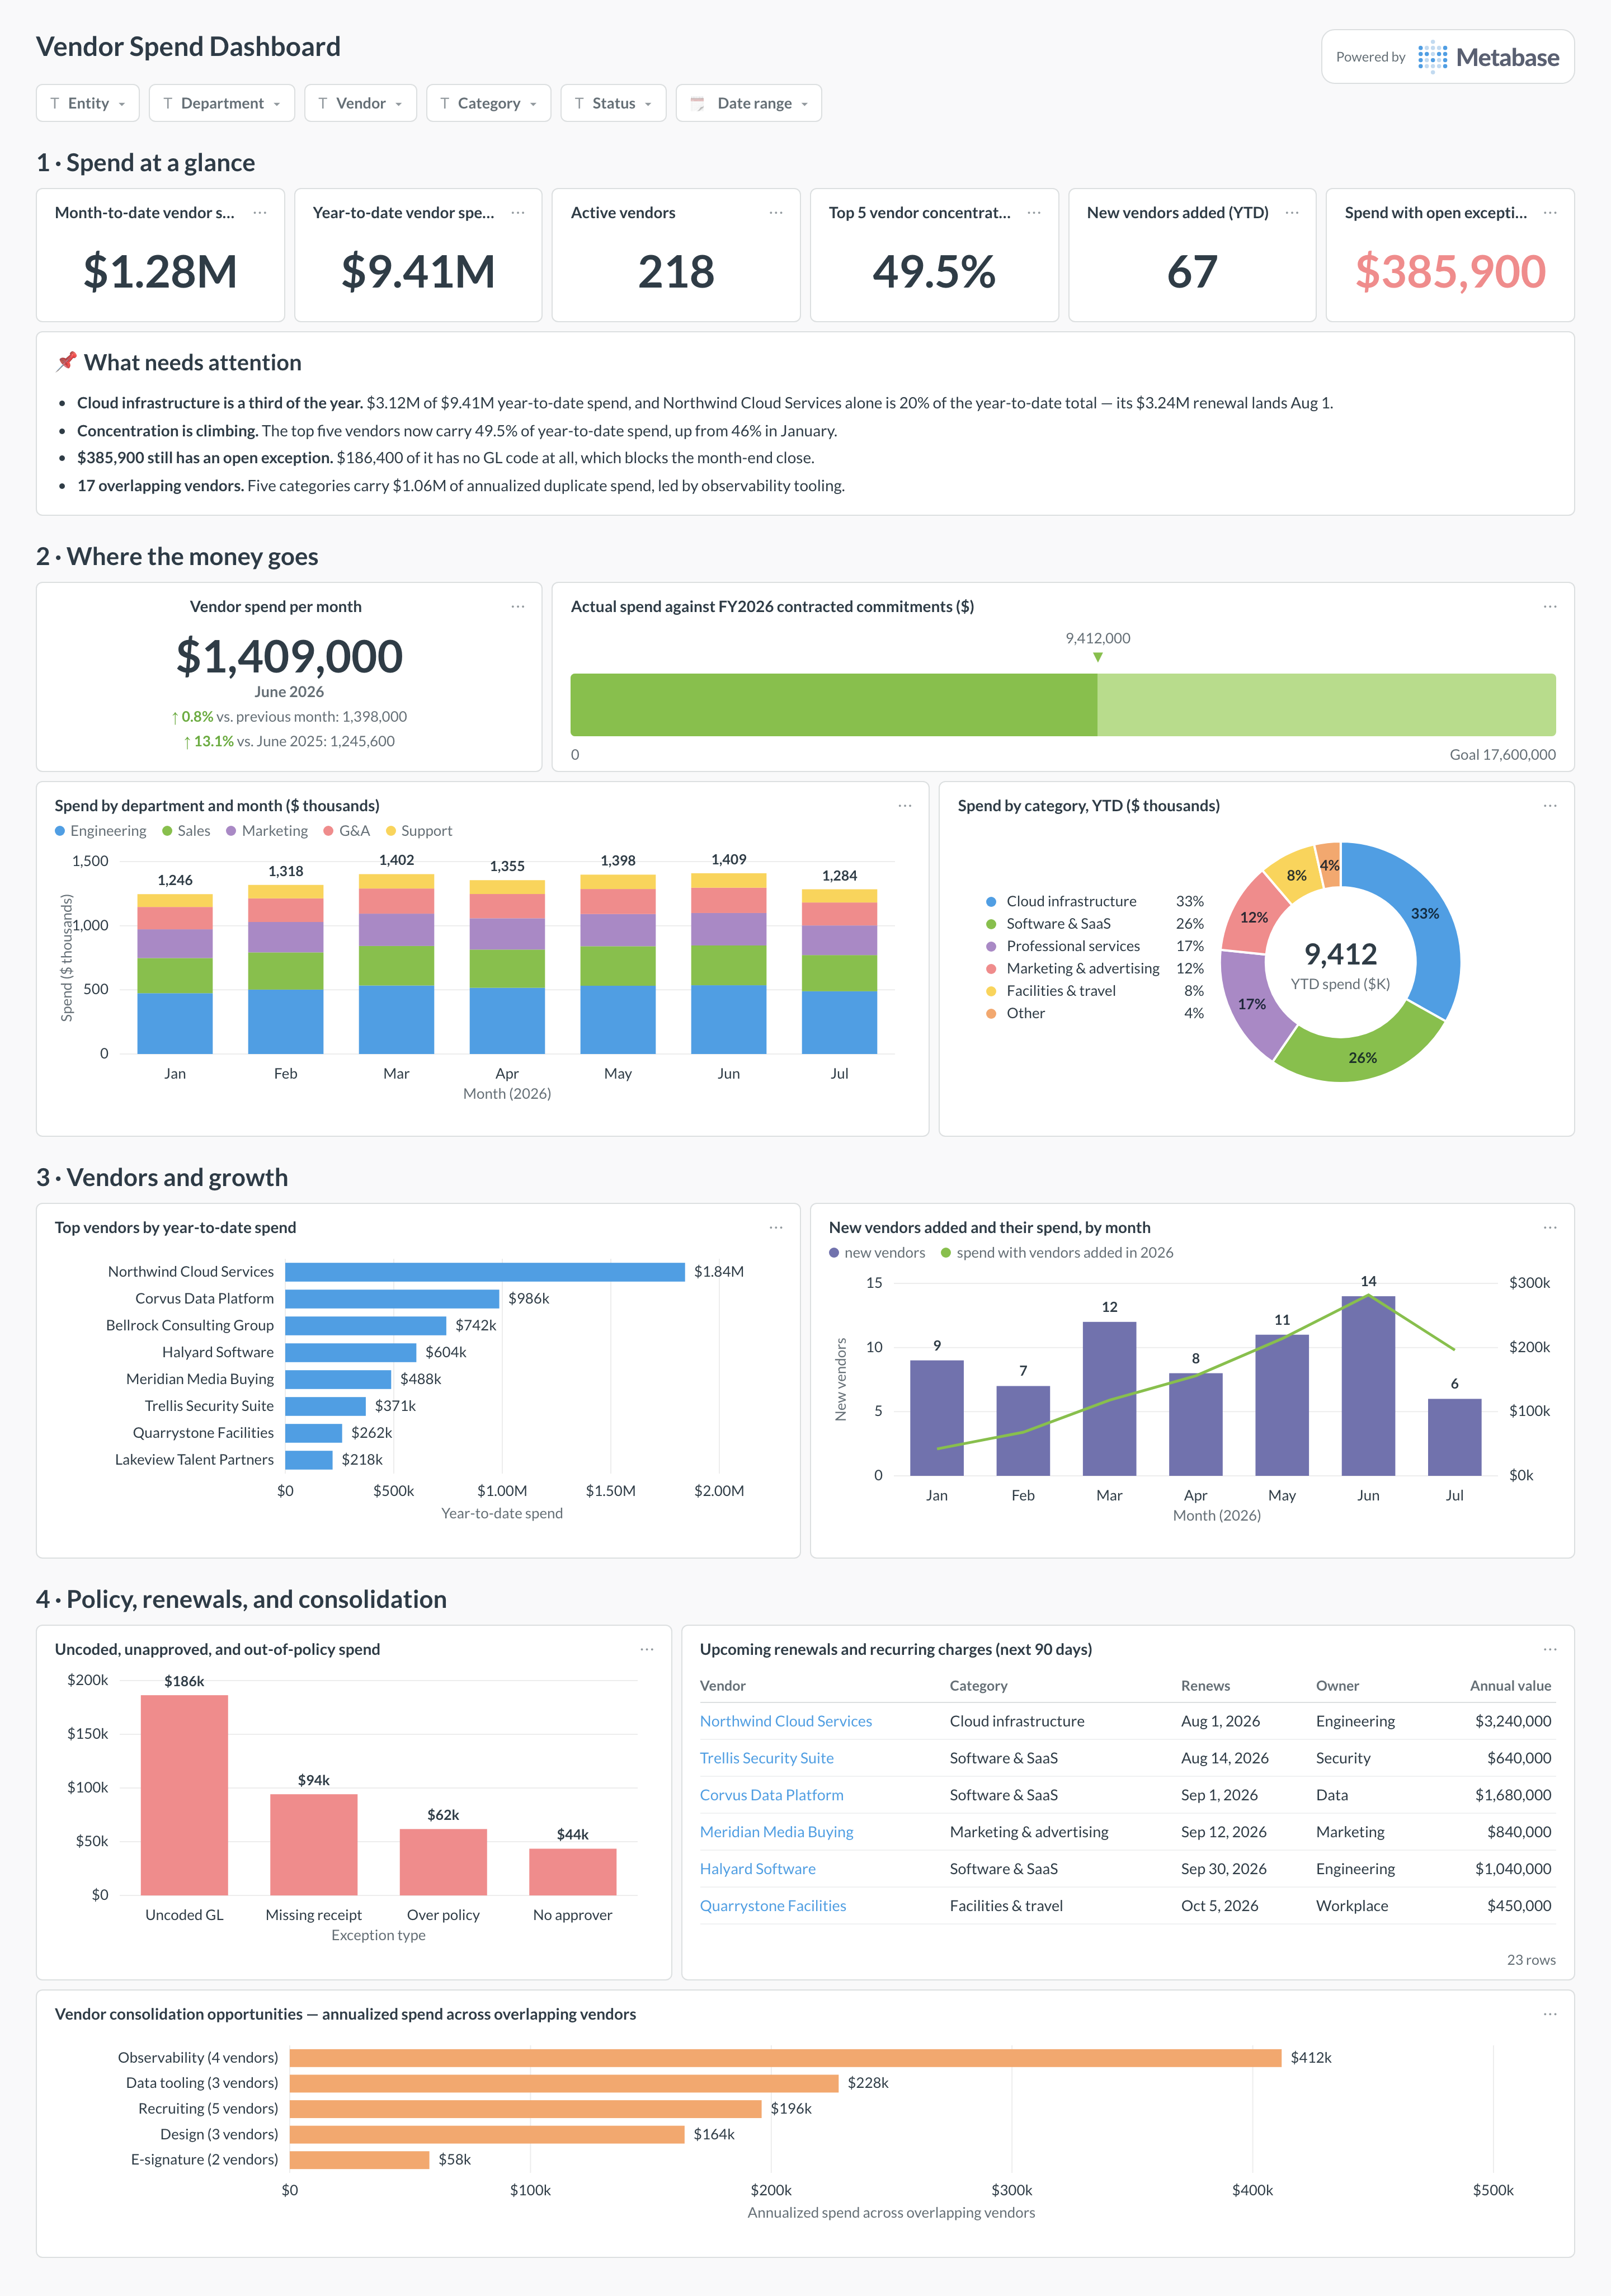
The layout moves from month-to-date and year-to-date totals to where the money goes by department and category, then to vendor concentration, renewals, and consolidation — read it before approving the next renewal.
Which cards belong on this dashboard?
- Month-to-date and year-to-date vendor spend
- Spend by department and category
- Top vendors and concentration
- New vendors and spend growth
- Committed vs. actual spend
- Upcoming renewals and recurring charges
- Uncoded, unapproved, or out-of-policy spend
- Vendor consolidation opportunities
What data does this dashboard need?
- Cleared card, bill, reimbursement, and AP transaction lines
- Normalized vendor master and aliases
- Department, category, GL account, owner, and approval status
- Purchase orders, commitments, and contract renewal dates
- ERP posting or export status for close readiness
How do you build it?
- Sync the source systems into a database and retain raw IDs, timestamps, status, and currency.
- Build reconciled models at the business grain this dashboard requires.
- Create one saved question per card and certify the shared models and definitions.
- Add dashboard filters for Entity, department, vendor, category, owner, status, date range.
- Show refresh time and the latest complete or reconciled period.
Example card SQL
Vendor concentration over the last 12 monthsPostgreSQL
WITH vendor_spend AS (
  SELECT
    normalized_vendor_id,
    normalized_vendor_name,
    SUM(reporting_currency_amount) AS spend
  FROM modeled_spend
  WHERE spend_date >= CURRENT_DATE - INTERVAL '12 months'
    AND spend_state IN ('CLEARED', 'POSTED')
  GROUP BY 1, 2
)
SELECT
  normalized_vendor_name,
  spend,
  ROUND(100.0 * spend / NULLIF(SUM(spend) OVER (), 0), 2) AS spend_share_pct
FROM vendor_spend
ORDER BY spend DESC
LIMIT 25;
Related
Dashboards
Integrations
Metrics
Analytics
FAQ
How do I avoid double-counting card and ERP spend?
Use lifecycle links or choose one authoritative stage. Do not sum pre-ERP card records with the journal entries created from them.
Why normalize vendors?
Merchant descriptors, legal names, and subsidiaries create duplicates that distort concentration and renewal analysis.