





What goes in a win-rate dashboard in Metabase?
A win-rate dashboard shows how often your deals close won, and — more usefully — where they don't. It turns a single headline number into an actionable view by segment, source, and stage. Build it from CRM data synced into a database — see HubSpot, Salesforce, or Pipedrive for the connection.
For: Sales leaders, RevOps. Refresh: daily.Source: modeled
deals/opportunities with stage, close date, amount, segment, and source.What does a win-rate dashboard look like?
Here's the layout this guide builds: the headline win rate and its monthly trend, then where deals convert — the stage funnel and win rate by segment, quarter, and lead source — then where they die, by furthest stage entered and loss reason. Read the breakdowns before the headline; the blended number hides most of what matters.
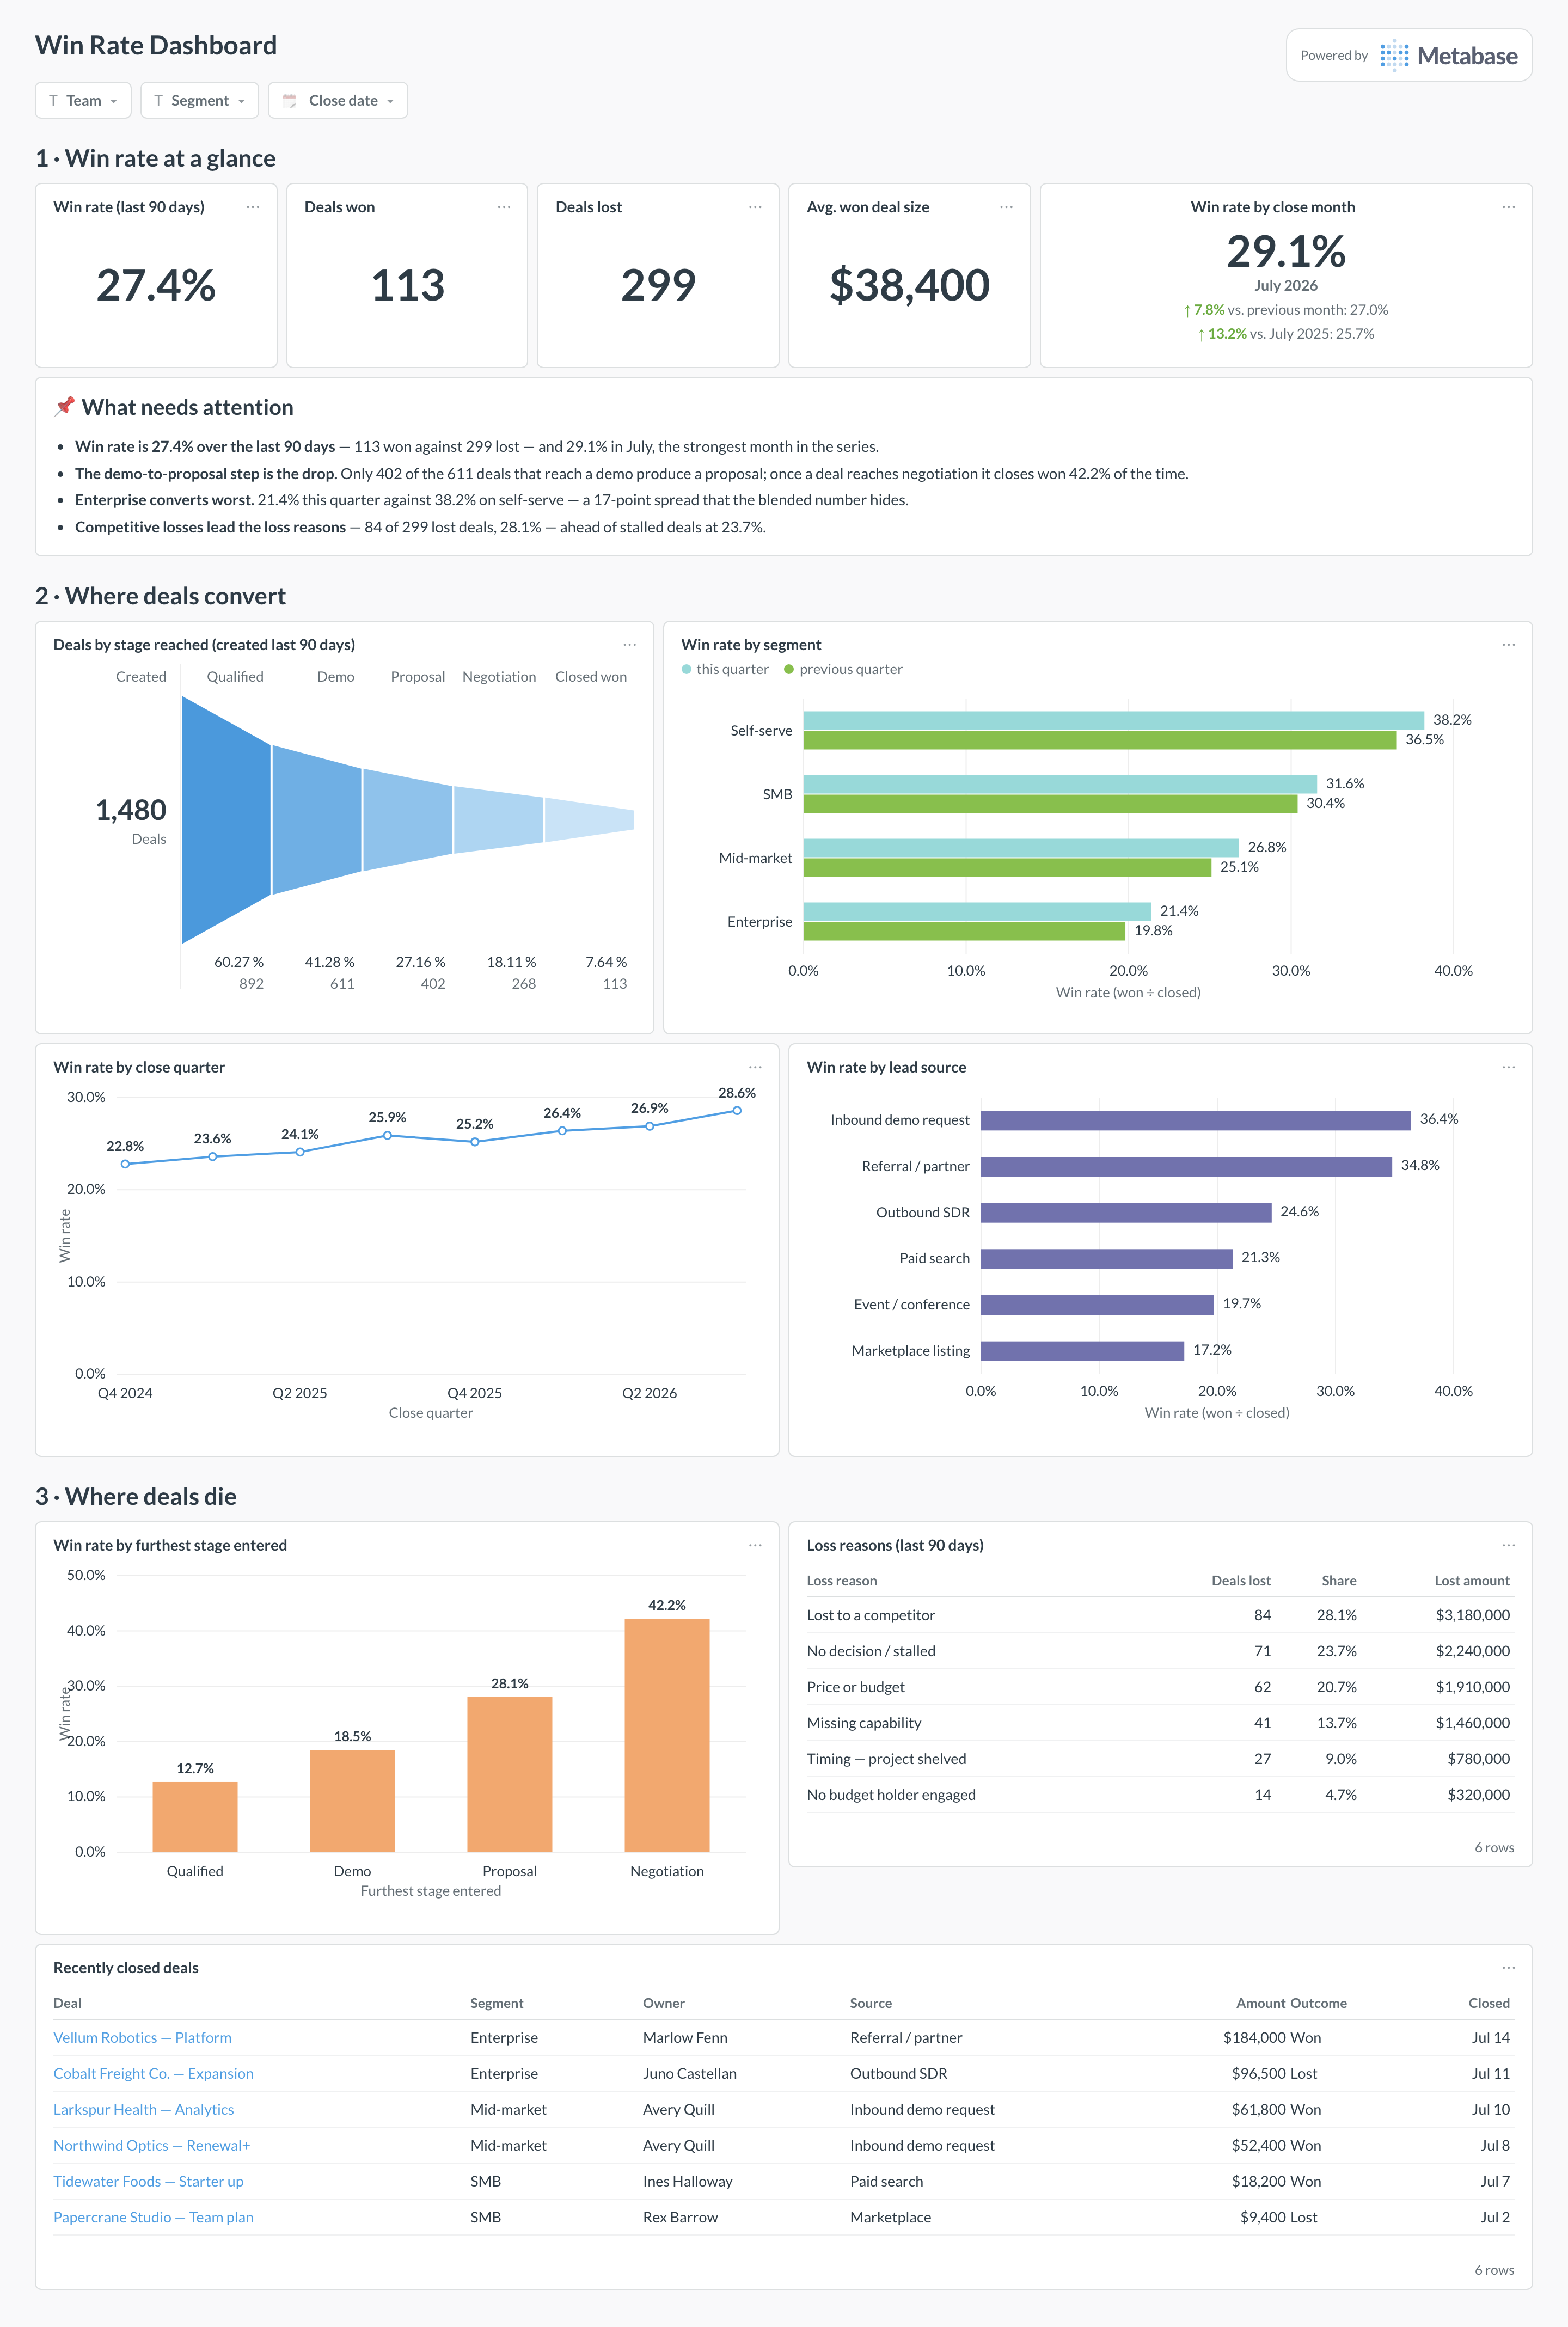
Which cards belong on a win-rate dashboard?
Headline KPIs
- Overall win rate (won ÷ closed)
- Win rate trend (by close month)
- Average deal size of won deals
- Deals won vs. lost this period
Breakdown
- Win rate by segment (size, region, industry)
- Win rate by lead source / channel
- Win rate by stage entered (where deals die)
- Loss reasons (table)
What data does a win-rate dashboard need?
- A modeled
deals/opportunities table with stage, close date, and amount. - A consistent won/lost definition and a fixed denominator (won ÷ closed).
- Segment, source, and loss-reason fields for the breakdowns.
How do you build a win-rate dashboard?
- Sync your CRM into a database (HubSpot, Salesforce, or Pipedrive).
- Fix the denominator — won ÷ (won + lost) — and say so on the chart.
- Build win rate overall and by segment, source, and stage entered.
- Add filters for team, segment, and close-date range.
Example card SQL
Win rate by close monthPostgreSQL
-- Win rate by close month: won ÷ closed (won + lost).
SELECT
  date_trunc('month', d.closed_at)                        AS month,
  COUNT(*) FILTER (WHERE d.stage = 'won')                 AS won,
  COUNT(*) FILTER (WHERE d.stage IN ('won','lost'))       AS closed,
  ROUND(100.0 * COUNT(*) FILTER (WHERE d.stage = 'won')
        / NULLIF(COUNT(*) FILTER (WHERE d.stage IN ('won','lost')), 0), 1)
                                                          AS win_rate_pct
FROM deals d
WHERE d.closed_at IS NOT NULL
GROUP BY date_trunc('month', d.closed_at)
ORDER BY month;
Related
Integrations
Analytics
Dashboards
Metrics
FAQ
Won over closed or won over created?
They give different numbers, so pick one and label it. Win rate as won ÷ closed (won + lost) measures how well you close deals that reach a decision; won ÷ created measures the whole funnel including deals still open. Most teams report won ÷ closed and track funnel conversion separately.
How do I stop open deals from distorting win rate?
Only count deals that have reached a terminal stage (won or lost) in the denominator. Deals still in the pipeline shouldn't count as losses; track them on a pipeline or forecast view instead so win rate stays a clean closed-deal metric.
Why break win rate down by stage entered?
Because overall win rate hides where deals actually die. Win rate by the furthest stage a deal reached shows whether you're losing early (qualification) or late (negotiation), which points to very different fixes.