




What is net revenue retention, and how do you measure it in Metabase?
Net revenue retention (NRR) measures how much recurring revenue you keep from an existing cohort of customers over time, including expansion and after churn and downgrades. Above 100% means your existing base grows even without new customers — the hallmark of a durable subscription business. Measure it in Metabase from billing data synced into a database (Stripe, Chargebee, Paddle, or Recurly).
What does a net revenue retention chart look like in Metabase?
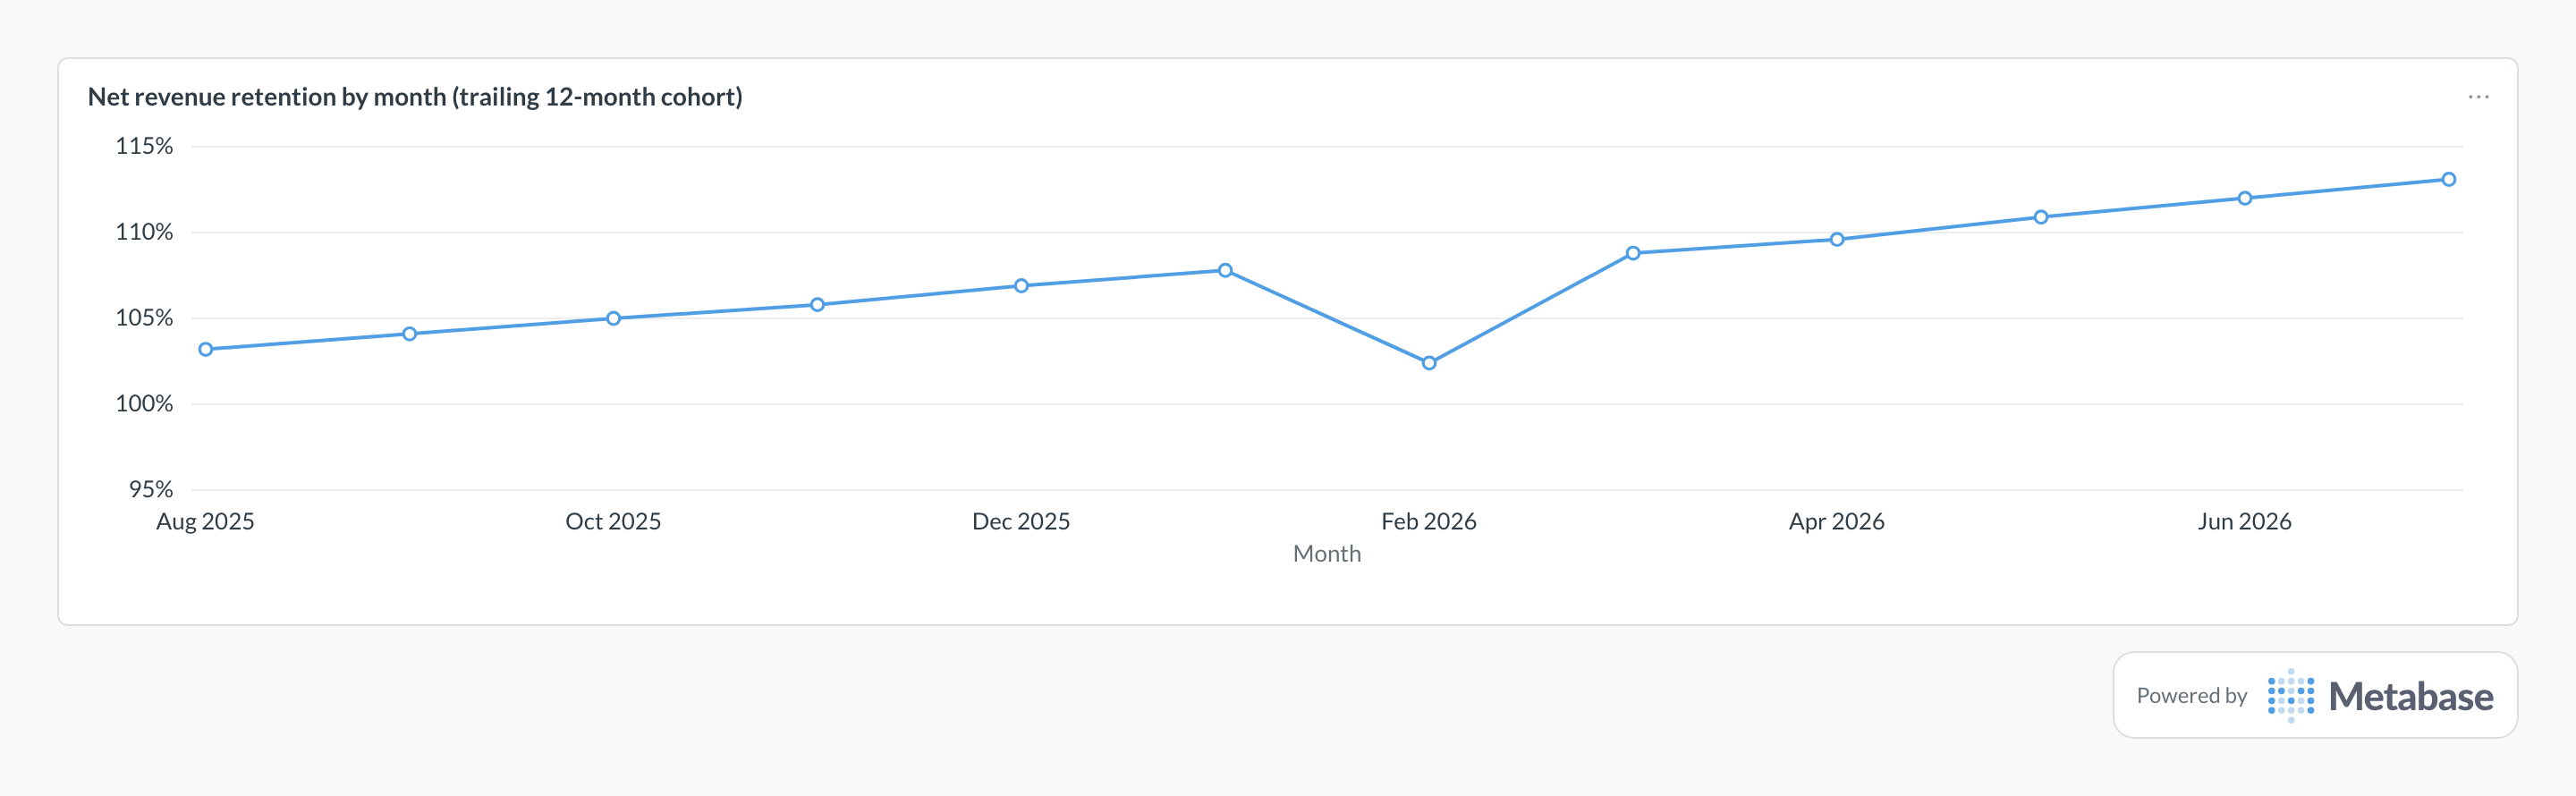
Compute the trailing 12-month cohort's NRR each month and read it against the 100% line: staying above it means the existing base grows with zero new logos, and the climb from about 103% to 113% is expansion steadily outrunning churn. A dip like Feb 2026's back toward 100% usually means one large account churned — check GRR for the same month to see whether the floor moved too.
How is NRR calculated?
Take a cohort of customers as of a start date, then compare their MRR one period later (typically 12 months):
NRR = (starting MRR + expansion − contraction − churned) ÷ starting MRR
- Only count customers who existed at the start — exclude new logos.
- Expansion (upgrades, add-ons, seats) pushes NRR up.
- Contraction and churn pull it down.
NRR vs. gross revenue retention (GRR)
- GRR counts only losses (churn + contraction) and caps each customer at their starting MRR — it can never exceed 100%. It shows how well you hold the floor.
- NRR also credits expansion, so it can exceed 100%. It shows whether the base compounds.
Report both: strong NRR with weak GRR means expansion is masking real churn.
What data does NRR need?
- A monthly MRR model at the customer grain.
- A stable customer identifier to follow a cohort across months.
- Expansion/contraction captured as MRR changes, not just plan swaps.
SQL patterns
Follows the customers active 12 months ago and compares their MRR today.
-- Requires a monthly MRR model with one row per customer per month
WITH cohort AS (          -- customers active 12 months ago
  SELECT customer_id, SUM(mrr) AS start_mrr
  FROM modeled_mrr
  WHERE month = date_trunc('month', CURRENT_DATE - INTERVAL '12 months')
  GROUP BY customer_id
),
now AS (                  -- the same customers' MRR today
  SELECT customer_id, SUM(mrr) AS end_mrr
  FROM modeled_mrr
  WHERE month = date_trunc('month', CURRENT_DATE)
  GROUP BY customer_id
)
SELECT
  ROUND(100.0 * SUM(COALESCE(n.end_mrr, 0)) / NULLIF(SUM(c.start_mrr), 0), 1)
    AS nrr_pct,
  ROUND(100.0 * SUM(LEAST(COALESCE(n.end_mrr, 0), c.start_mrr))
    / NULLIF(SUM(c.start_mrr), 0), 1) AS grr_pct
FROM cohort c
LEFT JOIN now n ON n.customer_id = c.customer_id;
Pitfalls
Where this metric applies
Each needs a customer-grain monthly MRR model built from synced subscription data.