





What does a code review health dashboard show in Metabase?
A code review health dashboard shows where pull requests wait — from open to first review to merge — so slow reviews become a visible, fixable queue. It's built from PR history synced from GitHub, GitLab, Bitbucket, or Azure DevOps.
For: engineering leads and team managers. Grain: one row per pull request, plus review events; bots and drafts flagged for exclusion.
What does a code review health dashboard look like?
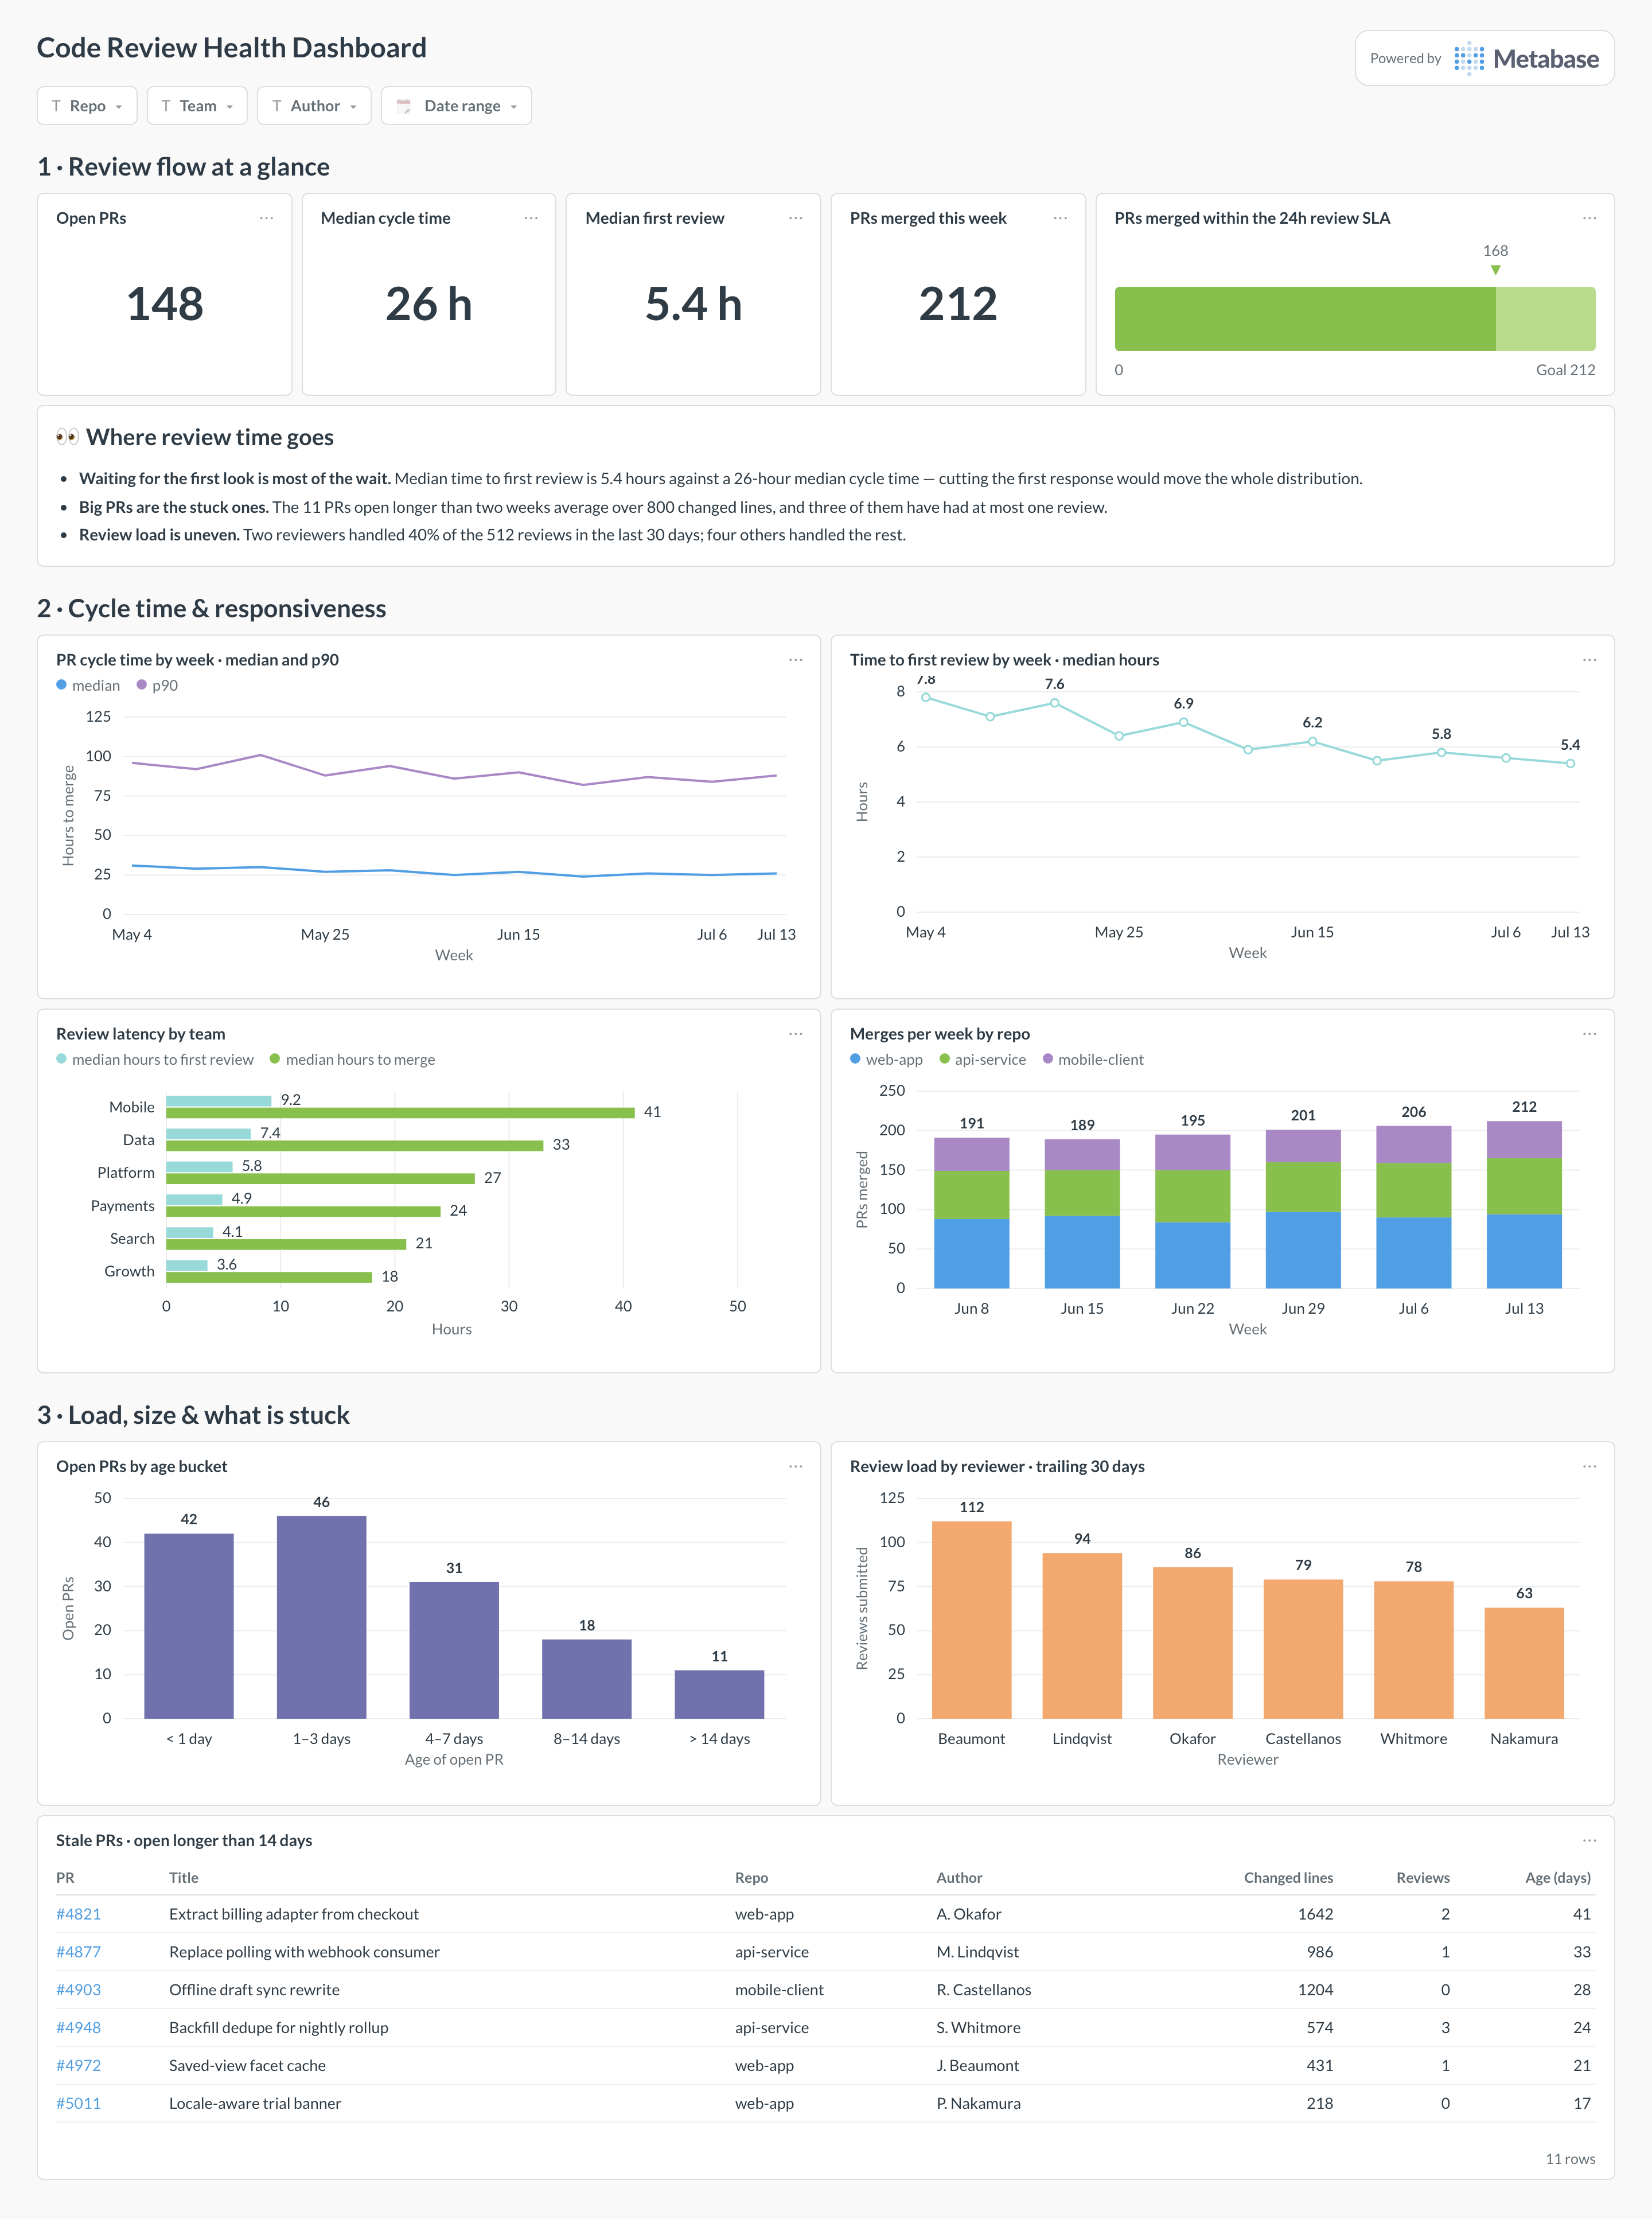
Here's the layout this guide builds: cycle time and responsiveness at the top, then how long reviews take by team and how much gets merged, then who is carrying the review load and which PRs are stuck. Read it in a weekly team review, not per PR.
Which cards belong on a code review health dashboard?
- PR cycle time, median and p90 by week (line)
- Time to first review by week (line)
- Open PRs by age bucket (bar)
- Review load by reviewer, trailing 30 days (bar)
- Stale PRs open longer than 14 days (table)
- Merges per week by repo (stacked bar)
What data does the dashboard need?
pull_requests— repo, author, state,created_at,first_review_at,merged_at, plusis_botanddraftflags.pr_reviewsevents — reviewer, PR, submitted timestamp, and verdict — for the load and first-review cards.- Synced from GitHub, GitLab, Bitbucket, or Azure DevOps Repos into a database or warehouse.
How do you build it?
- Sync PR and review history into a database — Metabase reads databases, not git hosts directly, so use an ETL connector or the platform's API.
- Derive
first_review_atas the earliest non-author review per PR if the source doesn't provide it. - Exclude bots and drafts from every headline card — they aren't waiting on humans and they skew the medians.
- Build the cycle-time and first-review trends first; add the stale-PR table and reviewer-load bar to drive the weekly review.
Example card SQL
Median cycle time and time to first review by weekPostgreSQL
SELECT
  DATE_TRUNC('week', merged_at) AS week,
  ROUND(
    (PERCENTILE_CONT(0.5) WITHIN GROUP (
      ORDER BY EXTRACT(EPOCH FROM merged_at - created_at)
    ) / 3600.0)::numeric, 1
  ) AS median_cycle_hours,
  ROUND(
    (PERCENTILE_CONT(0.5) WITHIN GROUP (
      ORDER BY EXTRACT(EPOCH FROM first_review_at - created_at)
    ) / 3600.0)::numeric, 1
  ) AS median_hours_to_first_review
FROM pull_requests
WHERE merged_at >= CURRENT_DATE - INTERVAL '12 weeks'
  AND NOT is_bot
  AND NOT draft
GROUP BY 1
ORDER BY 1;
Related
Metrics
Integrations
Dashboards
FAQ
What is a code review health dashboard?
A code review health dashboard shows where pull requests wait: how long PRs take from open to merge, how quickly the first review lands, and which reviewers carry the load. The git host shows one PR at a time; this dashboard sits on the full history in a database, so an engineering lead can see cycle time trends per repo and per team instead of guessing from the queue.
What data sources feed a code review health dashboard?
Pull request and review history from wherever code lives: GitHub, GitLab, Bitbucket, or Azure DevOps Repos. Metabase doesn't connect to these tools natively — it reads databases and warehouses — so sync PRs and review events into
pull_requests and pr_reviews tables with an ETL connector or the platform's API first.Why exclude bots and draft PRs from the headline numbers?
Because they aren't waiting on a human. Dependency-update bots open and merge PRs in minutes and can be half a repo's volume, dragging the median down; drafts aren't ready for review, so counting their age inflates time-to-first-review. Keep
is_bot and draft flags on every row, filter both out of headline cards, and chart bot volume separately if automation throughput matters to you.What's a reasonable time to first review?
Same-business-day is the common bar — a few hours in the same time zone — because the first review is where a PR either starts moving or starts rotting. But the trend beats the target: if median hours-to-first-review doubles, review capacity fell or PR volume spiked, and the review-load card shows which. Watch it alongside cycle time, since first-review lag is usually its biggest component.
How does code review health relate to DORA metrics?
Review wait is typically the largest slice of lead time for changes — code sits in review far longer than it sits in CI. When the DORA dashboard shows lead time stretching, this dashboard tells you whether the delay is first-review lag, long review cycles, or stale PRs nobody owns, and reviewer-load data points at the fix: rebalance, or staff the bottleneck.