What goes in a software delivery dashboard in Metabase?
A software delivery dashboard gives engineering and product leaders one view of flow, throughput, and quality. It's the exec roll-up that sits above per-team boards. Build it from issue-tracker data synced into a database — see Linear or Jira for the connection.
For: Eng leaders, EMs, PMs. Refresh: hourly is plenty. Source: modeled issues, cycles/sprints, projects (+ status history for flow metrics).
What does a software delivery dashboard look like?
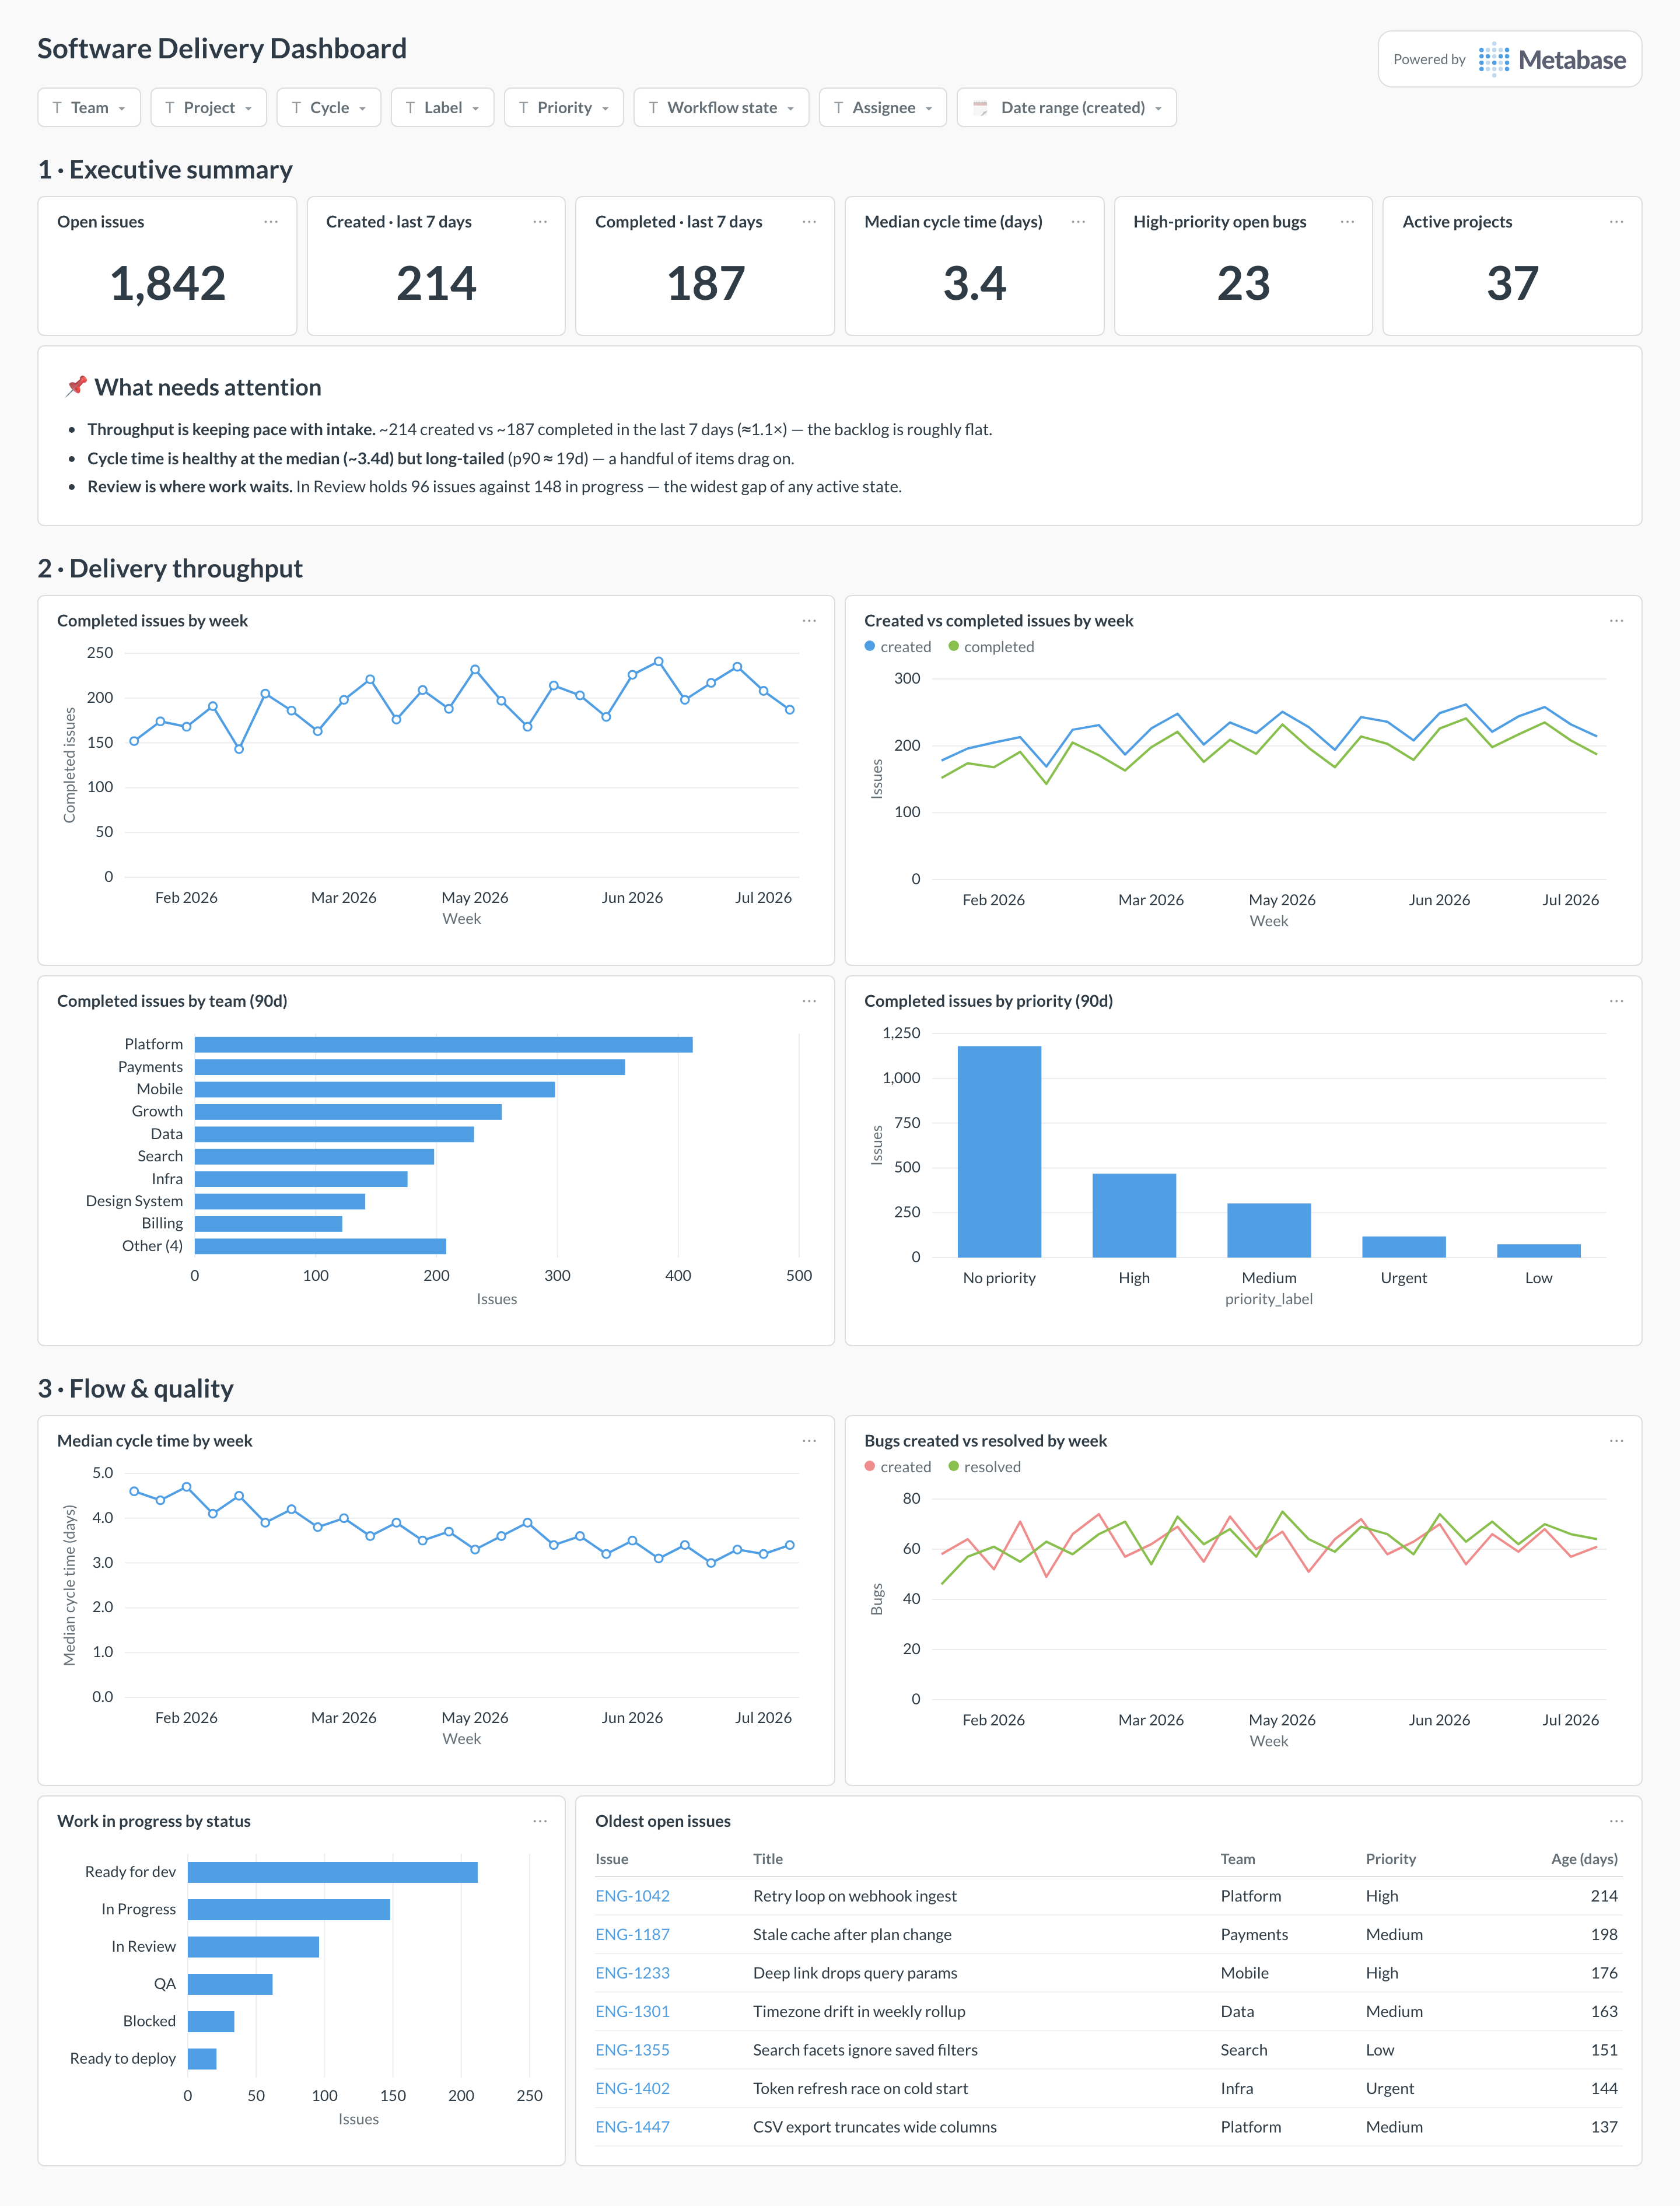
Here’s the layout this guide builds: an executive KPI row, weekly throughput and team breakdowns, then flow and quality cards. Everything on it comes from one modeled issues table plus status history, so an engineering leader can read delivery health without opening a single team’s board.
An example software delivery dashboard in Metabase, built from Linear or Jira data. Figures are illustrative.
Which cards belong on a software delivery dashboard?
What data does a software delivery dashboard need?
A modeled issues table with created_at, started_at, completed_at, state_type, team, priority.
For cycle time and time-in-status, a status-change history table. Without it, drop those cards or add a caveat.
How do you build a software delivery dashboard?
Sync your tracker into a database (Linear / Jira).
Model issues + iterations + projects; define state_type and derived cycle_time.
Create one saved question per card (SQL or query builder).
Add dashboard filters: team, project, iteration, priority, date range.
Example card SQL
Created vs. completed by weekPostgreSQL
SELECT
weeks.week,
COUNT(c.id) AS created,
COUNT(d.id) AS completed
FROM (
SELECT generate_series(date_trunc('week', CURRENT_DATE - INTERVAL '12 weeks'),
                       date_trunc('week', CURRENT_DATE), INTERVAL '1 week') AS week
) weeks
LEFT JOIN issues c ON date_trunc('week', c.created_at)   = weeks.week
LEFT JOIN issues d ON date_trunc('week', d.completed_at) = weeks.week
                AND d.state_type = 'completed'
GROUP BY weeks.week ORDER BY weeks.week;
A software delivery dashboard is the executive roll-up of engineering flow, throughput, and quality — open and completed issues, cycle time, work-in-progress, backlog age, and bug load — in one shared view that sits above per-team sprint boards. In Metabase you build it from issue-tracker data (Jira or Linear) synced into a SQL database, so leaders read the same governed numbers instead of screenshots from individual boards.
Can I build a software delivery dashboard without status history?
Yes for a lot of it. Throughput, open and completed issue counts, created-vs-completed trends, and bug/defect load all work from current-state fields alone. Only duration-based flow metrics — cycle time, time-in-status, and accurate mid-sprint scope change — need a status-change history (Jira's issue_changelog or Linear issue history). Without it, drop those cards or fall back to lead time (created → done) and add a caveat.
What's the difference between a software delivery dashboard and DORA metrics?
A software delivery dashboard is the broad view — throughput, cycle time, WIP, backlog, and quality from your issue tracker. DORA metrics are a focused four-metric framework — deployment frequency, lead time for changes, change failure rate, and time to restore service (MTTR) — sourced from CI/CD and incident data rather than tickets. Many teams add a DORA row so flow (speed of work) and stability (safety of releases) sit side by side.
What's the difference between velocity and throughput?
Velocity is completed story points per sprint or cycle and is best used as a within-team planning input, not a target. Throughput is the count of issues (or points) completed per week — tracker-agnostic and harder to game. For a leadership roll-up, prefer throughput and cycle time over raw velocity.
How often should a software delivery dashboard refresh?
Hourly is plenty for an executive delivery view, and daily is fine for a weekly leadership read. Issue-tracker data changes all day, but leaders read trends, not live counts, so a scheduled refresh from your synced Jira or Linear tables keeps warehouse and query costs low without missing anything.
Should I use these engineering metrics to compare teams or individuals?
No. Cycle time, throughput, and velocity all vary with team size, work type, and estimation habits, so cross-team leaderboards and per-developer rankings mislead and invite gaming. Use each metric as a within-team trend over time — is our cycle time improving? is throughput steady while WIP drops? — not as a scoreboard.
Which tools can feed a software delivery dashboard?
Any issue tracker you can sync into a SQL database: Linear, Jira, and others modeled onto the shared issue-tracking schema. Layer deploys from GitHub or GitLab and incidents from your on-call tool on top to add DORA metrics alongside flow and quality.
How do I reduce the cycle time shown on the dashboard?
Cycle time usually falls when work-in-progress falls, so show cycle time and WIP together. Use the time-in-status card to find where issues wait (often code review or blocked/QA), cap concurrent work per person, and split large issues into smaller ones — smaller batches complete faster and make the trend more predictable.