




What does a sprint health dashboard show in Metabase?
A sprint (or cycle) health dashboard answers one question each iteration: are we on track to finish what we committed to? It tracks committed vs. completed work, spillover, and scope change. Build it from Jira sprints or Linear cycles synced into a database.
For: EMs, scrum leads, delivery. Grain: one iteration (sprint/cycle). Source: modeled issues + sprints/cycles (+ issue-iteration history for accurate scope change).
What does a sprint health dashboard look like?
Here’s the layout this guide builds, at the grain of a single iteration: commitment and burndown at the top, then scope change and velocity across recent sprints, then the cards that show where the sprint is slipping. Read it mid-sprint to see whether the commitment still holds, and at retro to see why it did or didn’t.
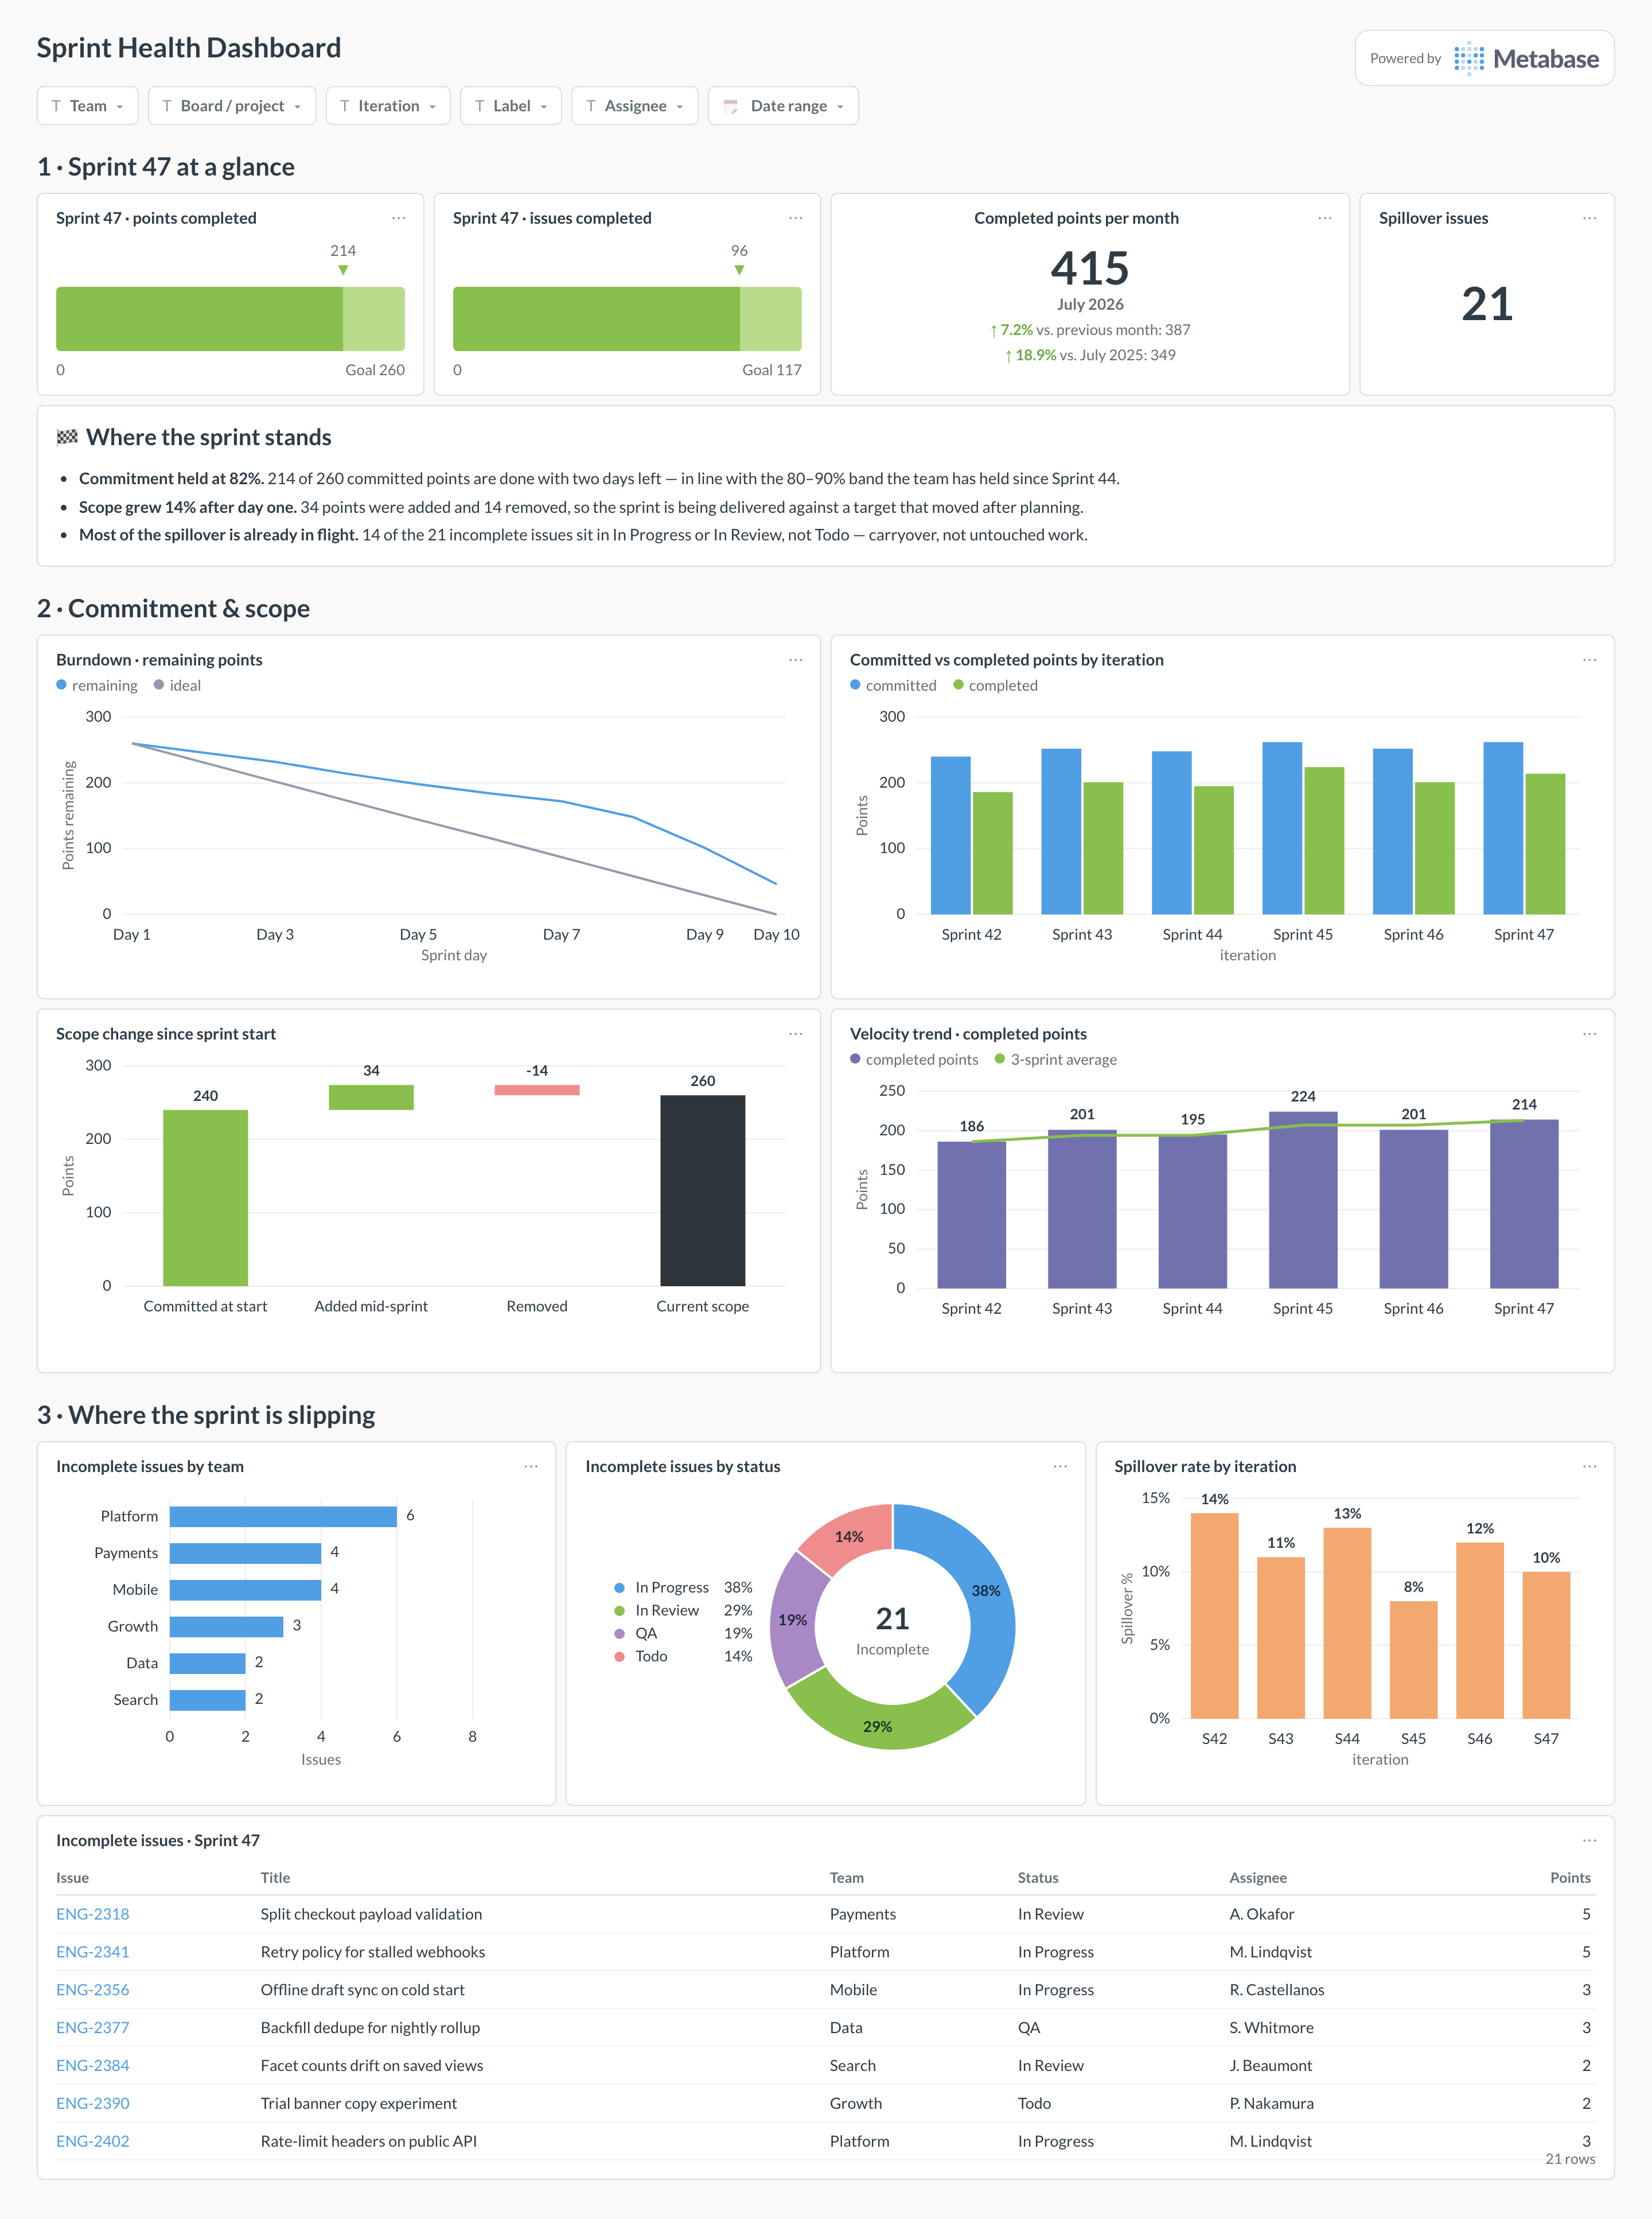
An example sprint health dashboard in Metabase, built from Jira sprints or Linear cycles. Figures are illustrative.
Which cards belong on a sprint health dashboard?
- Committed vs. completed (points and issue count) for the current iteration
- Spillover / carryover — items not finished in-iteration
- Scope added after start — issues assigned after it began (needs history)
- Burndown-style trend — remaining work over the iteration
- Incomplete issues by team — where the iteration is slipping
- Velocity trend — completed points over the last N iterations
What data does a sprint health dashboard need?
issueswithestimate/story_points,state_type/status_category, and an iteration key.sprints/cycleswithstart_date/end_date.- For scope change and burndown, issue-to-iteration change history — otherwise present current-state cards only and caveat the rest.
How do you build a sprint health dashboard?
- Sync sprints/cycles + issues (Jira / Linear).
- Model the iteration grain; define committed (in iteration at start) vs. completed (done by end).
- Build cards; add filters for team, board/cycle, and iteration.
Example card SQL
SELECT
it.name AS iteration,
it.start_date,
SUM(i.estimate)                                                  AS committed_points,
SUM(i.estimate) FILTER (WHERE i.state_type = 'completed')        AS completed_points,
COUNT(*) FILTER (WHERE i.state_type <> 'completed')              AS spillover_issues
FROM iterations it
JOIN issues i ON i.iteration_id = it.id
GROUP BY it.name, it.start_date
ORDER BY it.start_date;
Related
Integrations
Dashboards
Metrics
FAQ
Sprint vs. cycle — does this work for both?
Why is my scope-change (added-after-start) card empty?
issue_changelog (Sprint field changes); in Linear, from issue history. Without history, hide the card and note the limitation.