





What goes in a conversion funnel dashboard in Metabase?
A conversion funnel dashboard follows shoppers from visit to purchase and shows where they drop off — product views, add-to-cart, checkout, and completed orders. It's how you find the highest-leverage fix for conversion rate. Build it from store and event data synced into a database — see Shopify or BigCommerce for the connection.
For: Growth, merchandising, CRO. Refresh: daily.Source: modeled
sessions/events andorders, keyed so steps can be counted per session.What does a conversion funnel dashboard look like?
Here's the layout this guide builds: the headline conversion rates at the top, then the full session-to-purchase funnel with step-to-step conversion beside it, then the same conversion rate cut by device, channel, and landing page. Read the funnel to find the leaking step, then the segment cards to find who is leaking.
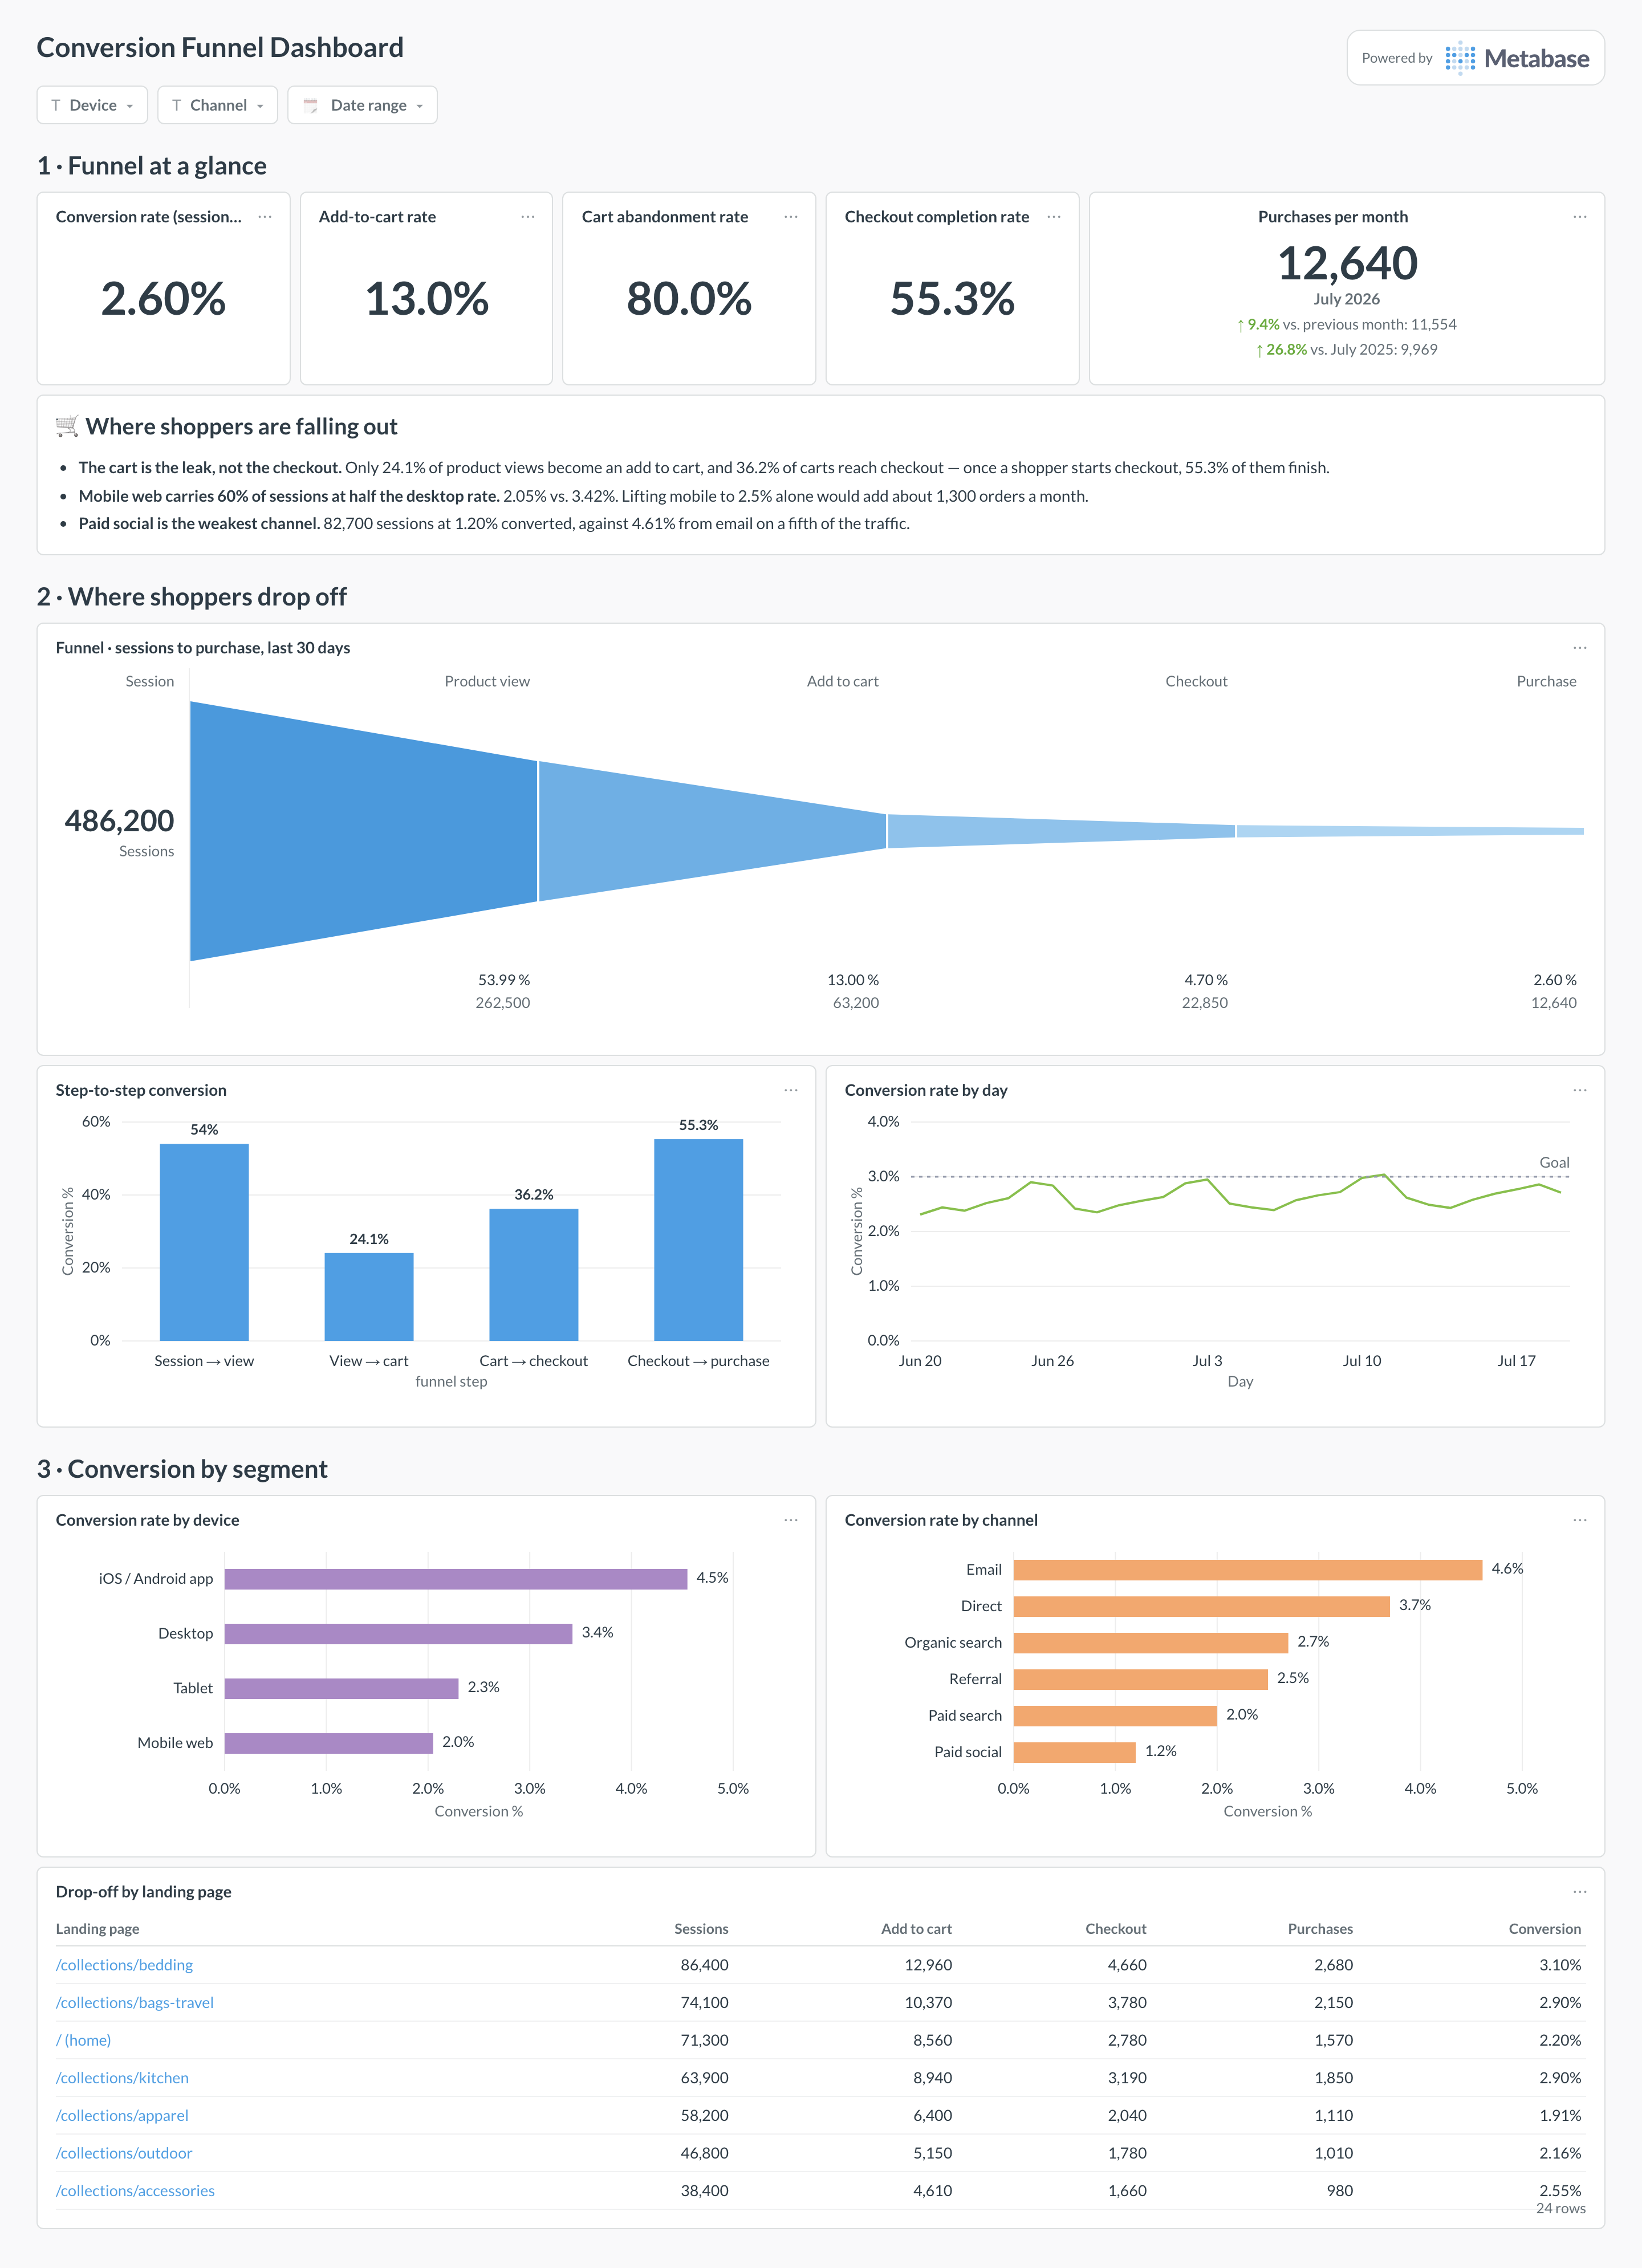
Which cards belong on a conversion funnel dashboard?
Headline KPIs
- Overall conversion rate (session → purchase)
- Cart abandonment rate
- Checkout completion rate
- Add-to-cart rate
Funnel & segments
- Funnel steps: sessions → product view → add to cart → checkout → purchase
- Step-to-step conversion
- Conversion by device (mobile vs. desktop)
- Conversion by channel / traffic source
- Drop-off by landing page or category
What data does a conversion funnel dashboard need?
- A modeled
sessions/eventstable with a step or event type and a session key. - The
orderstable to close the funnel at purchase. - Device, channel, and landing-page attributes for segmentation.
How do you build a conversion funnel dashboard?
- Sync your store and its events into a database (Shopify or BigCommerce).
- Model events into funnel steps keyed by session.
- Count each step and derive step-to-step and overall conversion.
- Add filters for device, channel, and date range.
Example card SQL
Funnel counts and overall conversionPostgreSQL
-- Funnel counts and step conversion over the last 30 days,
-- from a modeled sessions/events table.
WITH steps AS (
  SELECT
    COUNT(*) FILTER (WHERE step = 'session')          AS sessions,
    COUNT(*) FILTER (WHERE step = 'product_view')     AS product_views,
    COUNT(*) FILTER (WHERE step = 'add_to_cart')      AS add_to_cart,
    COUNT(*) FILTER (WHERE step = 'checkout')         AS checkout,
    COUNT(*) FILTER (WHERE step = 'purchase')         AS purchases
  FROM funnel_events
  WHERE occurred_at >= CURRENT_DATE - INTERVAL '30 days'
)
SELECT
  sessions, product_views, add_to_cart, checkout, purchases,
  ROUND(100.0 * purchases / NULLIF(sessions, 0), 2)   AS overall_conversion_pct
FROM steps;
Related
Integrations
Analytics
Dashboards
Metrics
FAQ
What's the difference between cart abandonment and checkout abandonment?
Cart abandonment is shoppers who add items but never start checkout; checkout abandonment is those who start checkout but don't complete the order. Splitting the two tells you whether to fix the path to checkout or the checkout itself — often the single biggest conversion win.
Do I need a separate analytics tool for the funnel?
Not necessarily. If you sync store events (or a product-analytics event stream) into your database, you can model the funnel directly in Metabase and join it to order and AOV data — one place, one definition of conversion.
Why segment conversion by device and channel?
Because a blended conversion rate hides big differences: mobile usually converts lower than desktop, and paid traffic converts differently from email. Segmenting shows where the drop-off actually concentrates so you fix the right step for the right audience.