





What goes in a product performance dashboard in Metabase?
A product performance dashboard shows which products drive the business — best sellers, revenue and units by product and category, return rates, and what's not moving. It's the merchandising and inventory view. Build it from store data synced into a database — see Shopify or WooCommerce for the connection.
For: Merchandising, buying, ops. Refresh: daily.Source: modeled
order_line_items joined to orders and a products/variants table.What does a product performance dashboard look like?
Here's the layout this guide builds: catalog-level KPIs at the top, then best sellers by revenue with a price-versus-units scatter and a full product detail table, then the merchandising cards — category mix, return rate, basket lift, and what is sitting still or out of stock.
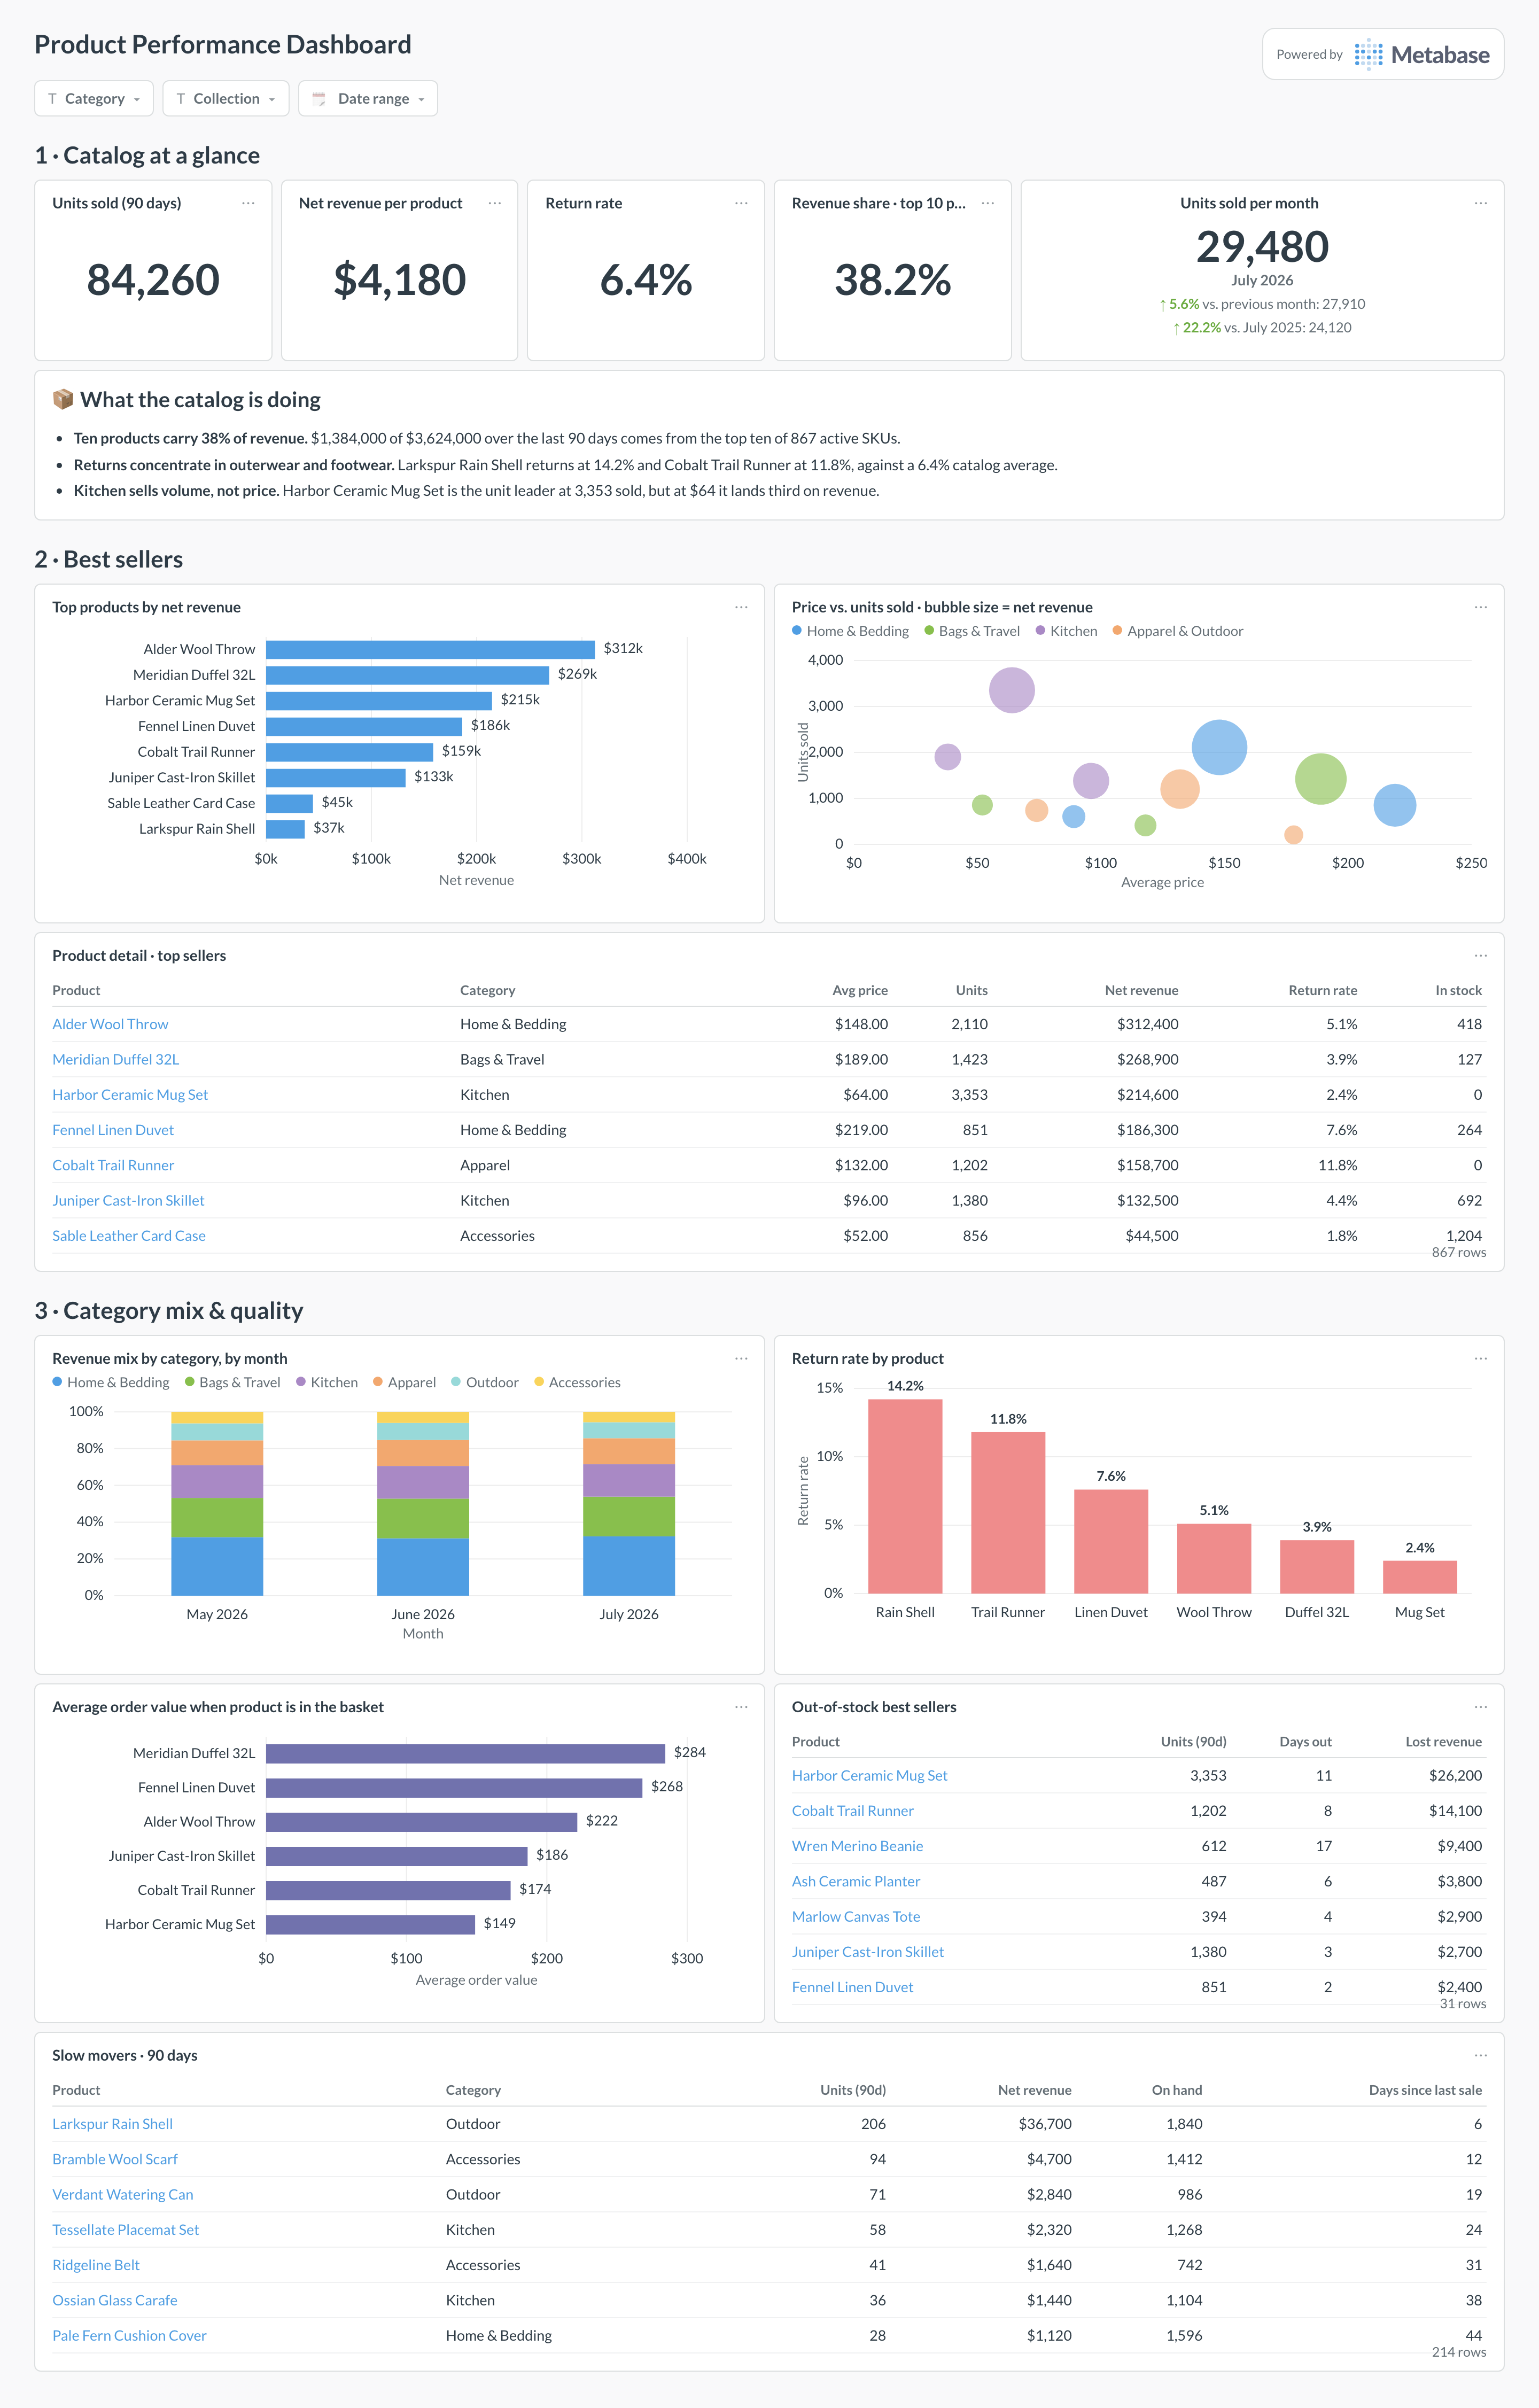
Which cards belong on a product performance dashboard?
Headline KPIs
- Products sold (units) this period
- Revenue per product (average)
- Return rate
- Share of revenue from top 10 products
Detail
- Top products by net revenue and by units
- Revenue by category / collection
- Return rate by product (quality signal)
- Slow movers and out-of-stock best sellers (tables)
- AOV contribution by product
What data does a product performance dashboard need?
- An
order_line_itemstable with product, quantity, and net price. - A products/variants table for names, categories, and SKUs.
- Returns/refunds at the line level for return rate.
- Inventory levels if you want stock signals.
How do you build a product performance dashboard?
- Sync your store into a database (Shopify or WooCommerce).
- Model line items joined to orders and products; use net price per line.
- Build best-seller, category, and return-rate cards.
- Add filters for category, collection, and date range.
Example card SQL
Top products by net revenuePostgreSQL
-- Top products by net revenue with units and return rate, last 90 days.
SELECT
  li.product_title,
  SUM(li.quantity)                                        AS units,
  ROUND(SUM(li.net_price), 2)                             AS net_revenue,
  ROUND(100.0 * SUM(li.returned_quantity)
        / NULLIF(SUM(li.quantity), 0), 1)                 AS return_rate_pct
FROM order_line_items li
JOIN orders o ON o.id = li.order_id
WHERE o.created_at >= CURRENT_DATE - INTERVAL '90 days'
  AND o.financial_status = 'paid'
GROUP BY li.product_title
ORDER BY net_revenue DESC
LIMIT 50;
Related
Integrations
Analytics
Dashboards
Metrics
FAQ
Should product revenue be gross or net?
Use net line revenue — after line-level discounts and refunds — so best sellers reflect what you actually keep. A heavily discounted product can top gross revenue while contributing far less margin, which is exactly what the net view exposes.
Why track return rate by product?
Because a high-revenue product with a high return rate can be a quality or sizing problem in disguise. Return rate by product turns the dashboard from a sales ranking into a merchandising-quality signal, and flags SKUs to fix or drop.
How do I spot missed revenue from stockouts?
Cross-reference best sellers with inventory levels: a top product that's frequently out of stock is lost revenue. A card listing out-of-stock best sellers makes the buying and replenishment decision obvious.