





What goes in a cohort retention dashboard in Metabase?
A cohort retention dashboard groups customers by when they signed up and follows each cohort's revenue over time. It answers the question a blended churn rate can't: is retention actually improving for newer customers? Build it from billing data synced into a database — see Stripe or Chargebee for the connection.
For: Finance, product, growth. Refresh: daily or weekly. Source: a monthly MRR model keyed to subscriptions, plus a signup/first-order date per customer.
What does a cohort retention dashboard look like?
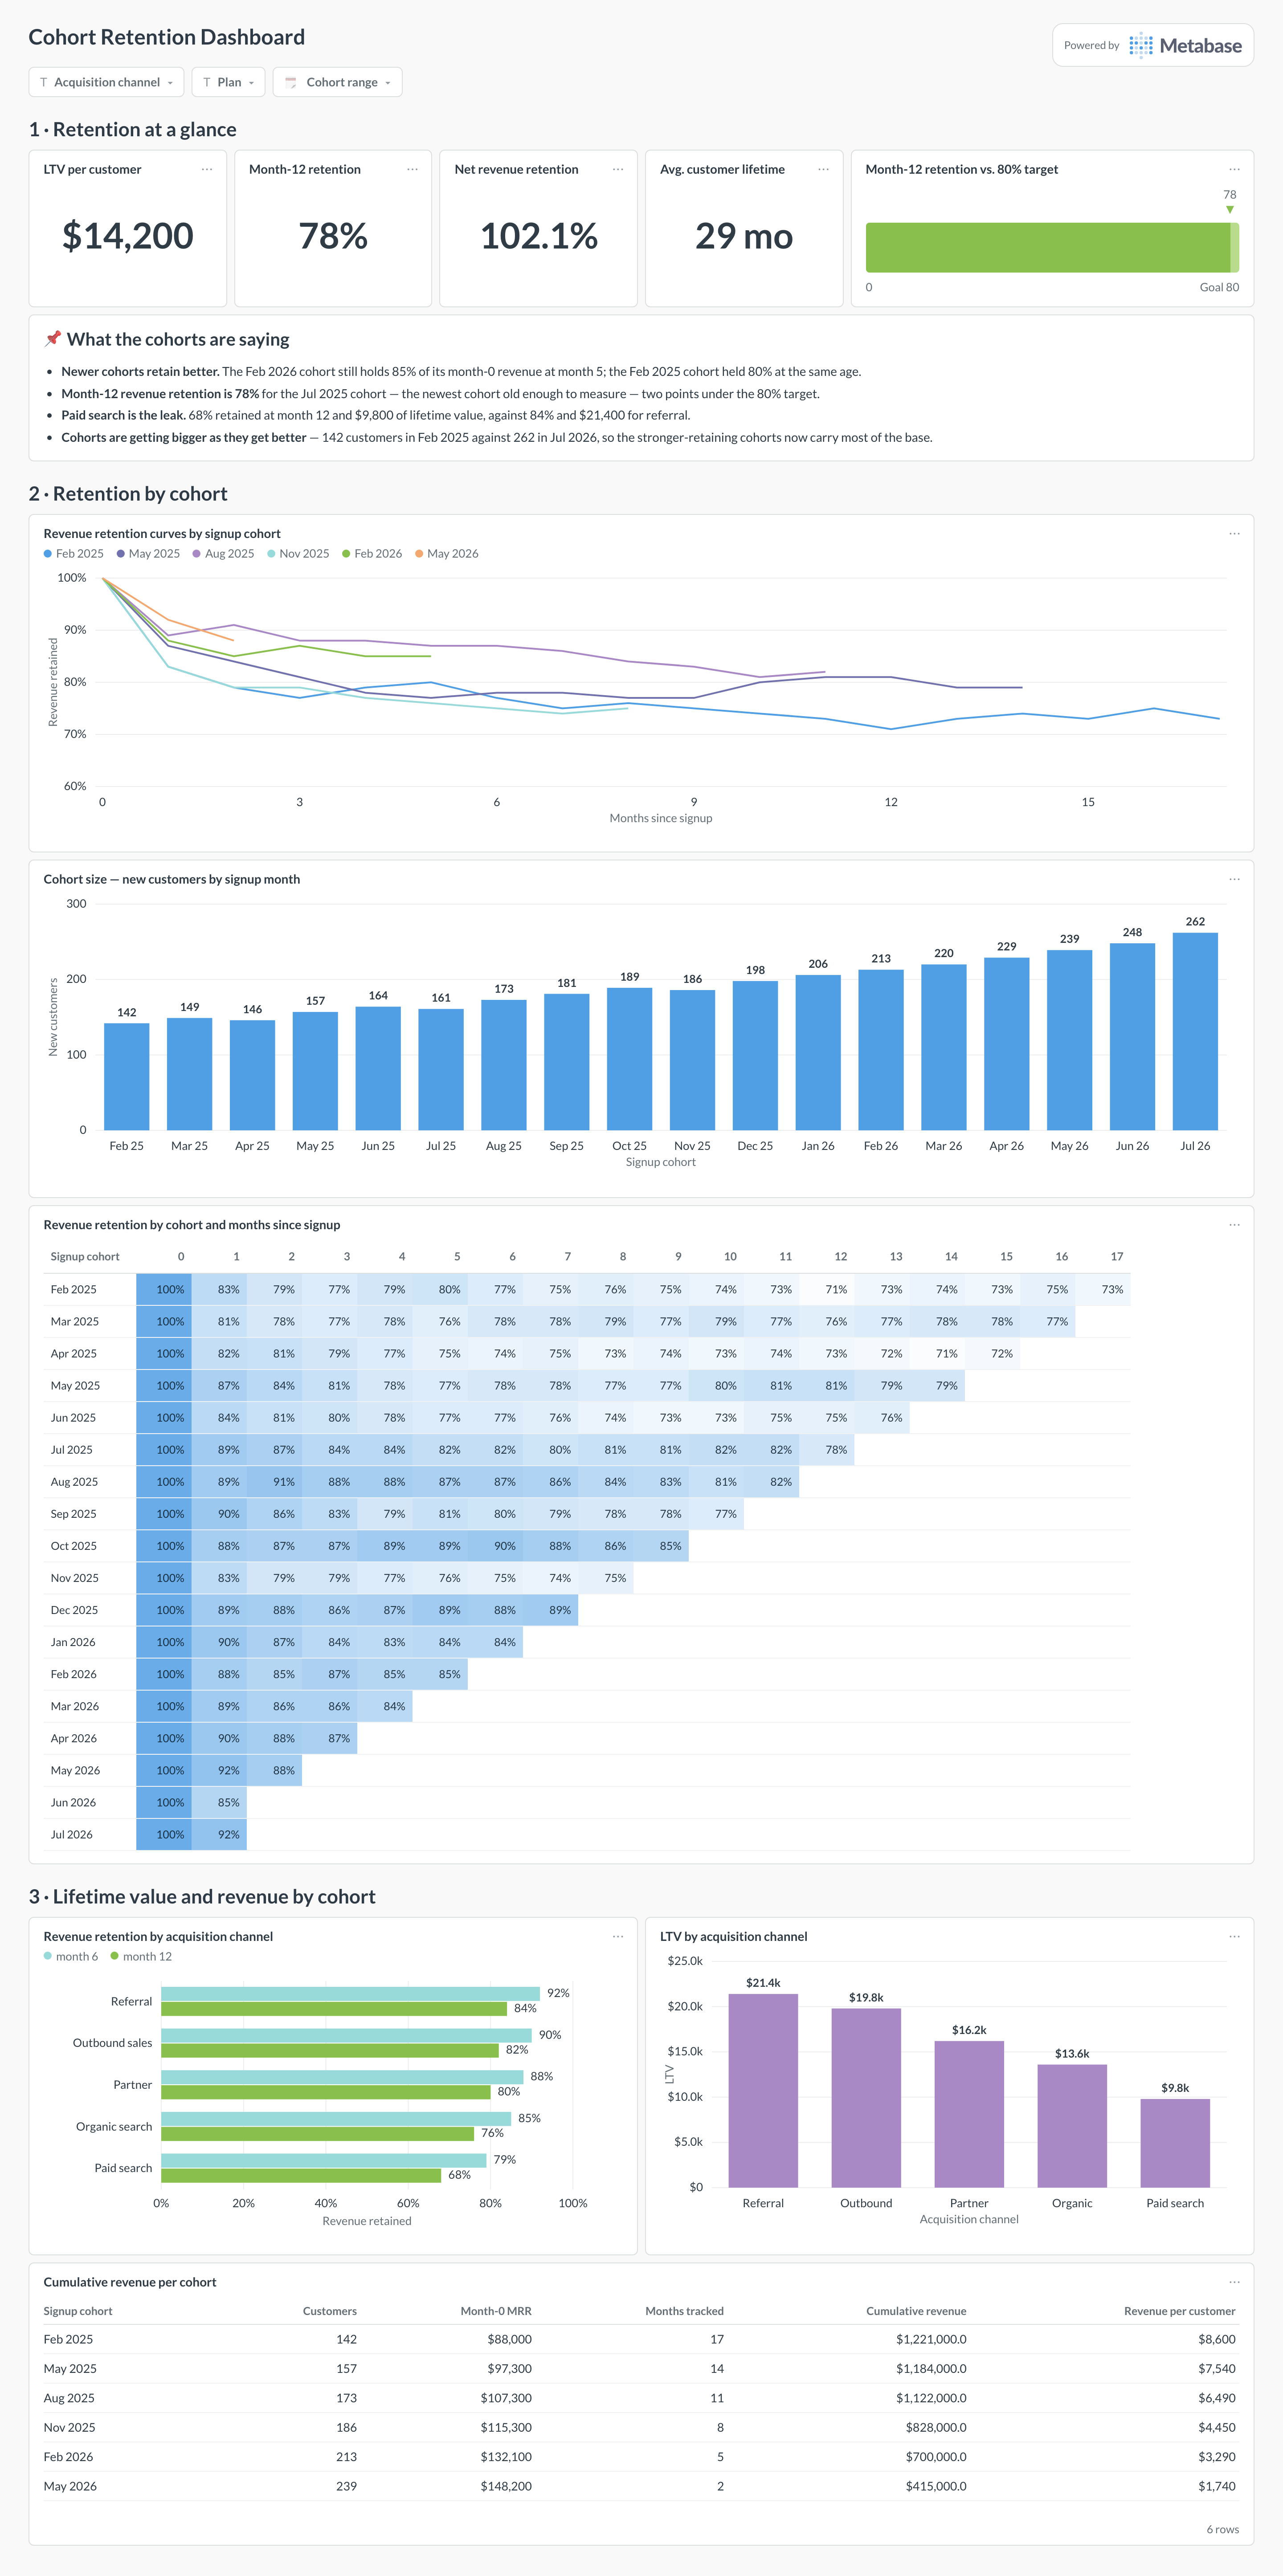
Here's the layout this guide builds: lifetime value and month-12 retention at the top, then one retention curve per signup cohort with the same numbers as a cohort-by-month table, then lifetime value and cumulative revenue by cohort and channel. Read it when you want to know whether the customers you are acquiring now are better than the ones you acquired a year ago.
Which cards belong on a cohort retention dashboard?
Headline KPIs
- LTV — average lifetime value per customer
- Month-12 revenue retention
- Net revenue retention
- Average customer lifetime (months)
Cohort views
- Revenue-retention heatmap — cohort × months since signup
- Retention curves by cohort (line)
- LTV by acquisition cohort or channel
- Cumulative revenue per cohort (table)
What data does a cohort retention dashboard need?
- A monthly MRR model keyed to subscriptions.
- A signup or first-paid date per customer to define the cohort.
- Optionally an acquisition channel or plan for cohort segmentation and LTV by source.
How do you build a cohort retention dashboard?
- Sync your billing tool into a database (Stripe or Chargebee).
- Assign each customer a cohort month from their first paid subscription.
- Compute MRR per cohort per months-since-signup; retention is that MRR ÷ the cohort's month-0 MRR.
- Visualize as a heatmap and curves; add filters for channel, plan, and cohort range.
Example card SQL
Revenue retention by cohortPostgreSQL
-- Revenue retention by signup cohort and months-since-signup.
WITH base AS (
  SELECT
    date_trunc('month', s.started_at)                    AS cohort_month,
    date_trunc('month', m.month)                         AS active_month,
    m.mrr,
    s.customer_id
  FROM subscriptions s
  JOIN modeled_mrr m ON m.subscription_id = s.id
)
SELECT
  cohort_month,
  (EXTRACT(YEAR FROM active_month) - EXTRACT(YEAR FROM cohort_month)) * 12
    + (EXTRACT(MONTH FROM active_month) - EXTRACT(MONTH FROM cohort_month)) AS month_index,
  ROUND(SUM(mrr), 2)                                     AS mrr
FROM base
GROUP BY cohort_month, month_index
ORDER BY cohort_month, month_index;
Related
Integrations
Analytics
Dashboards
Metrics
FAQ
Why use cohorts instead of a single churn number?
A blended churn rate mixes long-tenured customers with brand-new ones and can hide whether retention is getting better or worse. Cohorting by signup month holds tenure constant, so you can see if, say, the customers you acquired this quarter are sticking better than last quarter's.
What's the difference between revenue and logo retention curves?
A logo (customer) retention curve tracks the share of customers still active; a revenue retention curve tracks the share of MRR retained, which can climb back above 100% when expansion outpaces churn. Show revenue retention for the money view and logo retention for the product-fit view.
How does this connect to LTV?
Cohort retention curves are the raw material for lifetime value: the area under a cohort's retained-revenue curve (adjusted for margin) is its LTV. Building retention as cohorts makes LTV a natural, defensible output rather than a single blunt multiplier.