





What goes in a team and tag cost allocation dashboard?
A cost allocation dashboard maps every dollar of cloud spend to an owner — a team, product, or cost center — via tags and labels, and is honest about the dollars that don't map. Its credibility rests on one number: the untagged spend rate.
For: FinOps, team leads, engineering managers, and finance. Refresh: daily.Source: modeled billing and cost tables in a Metabase-connected database.
What does this dashboard look like?
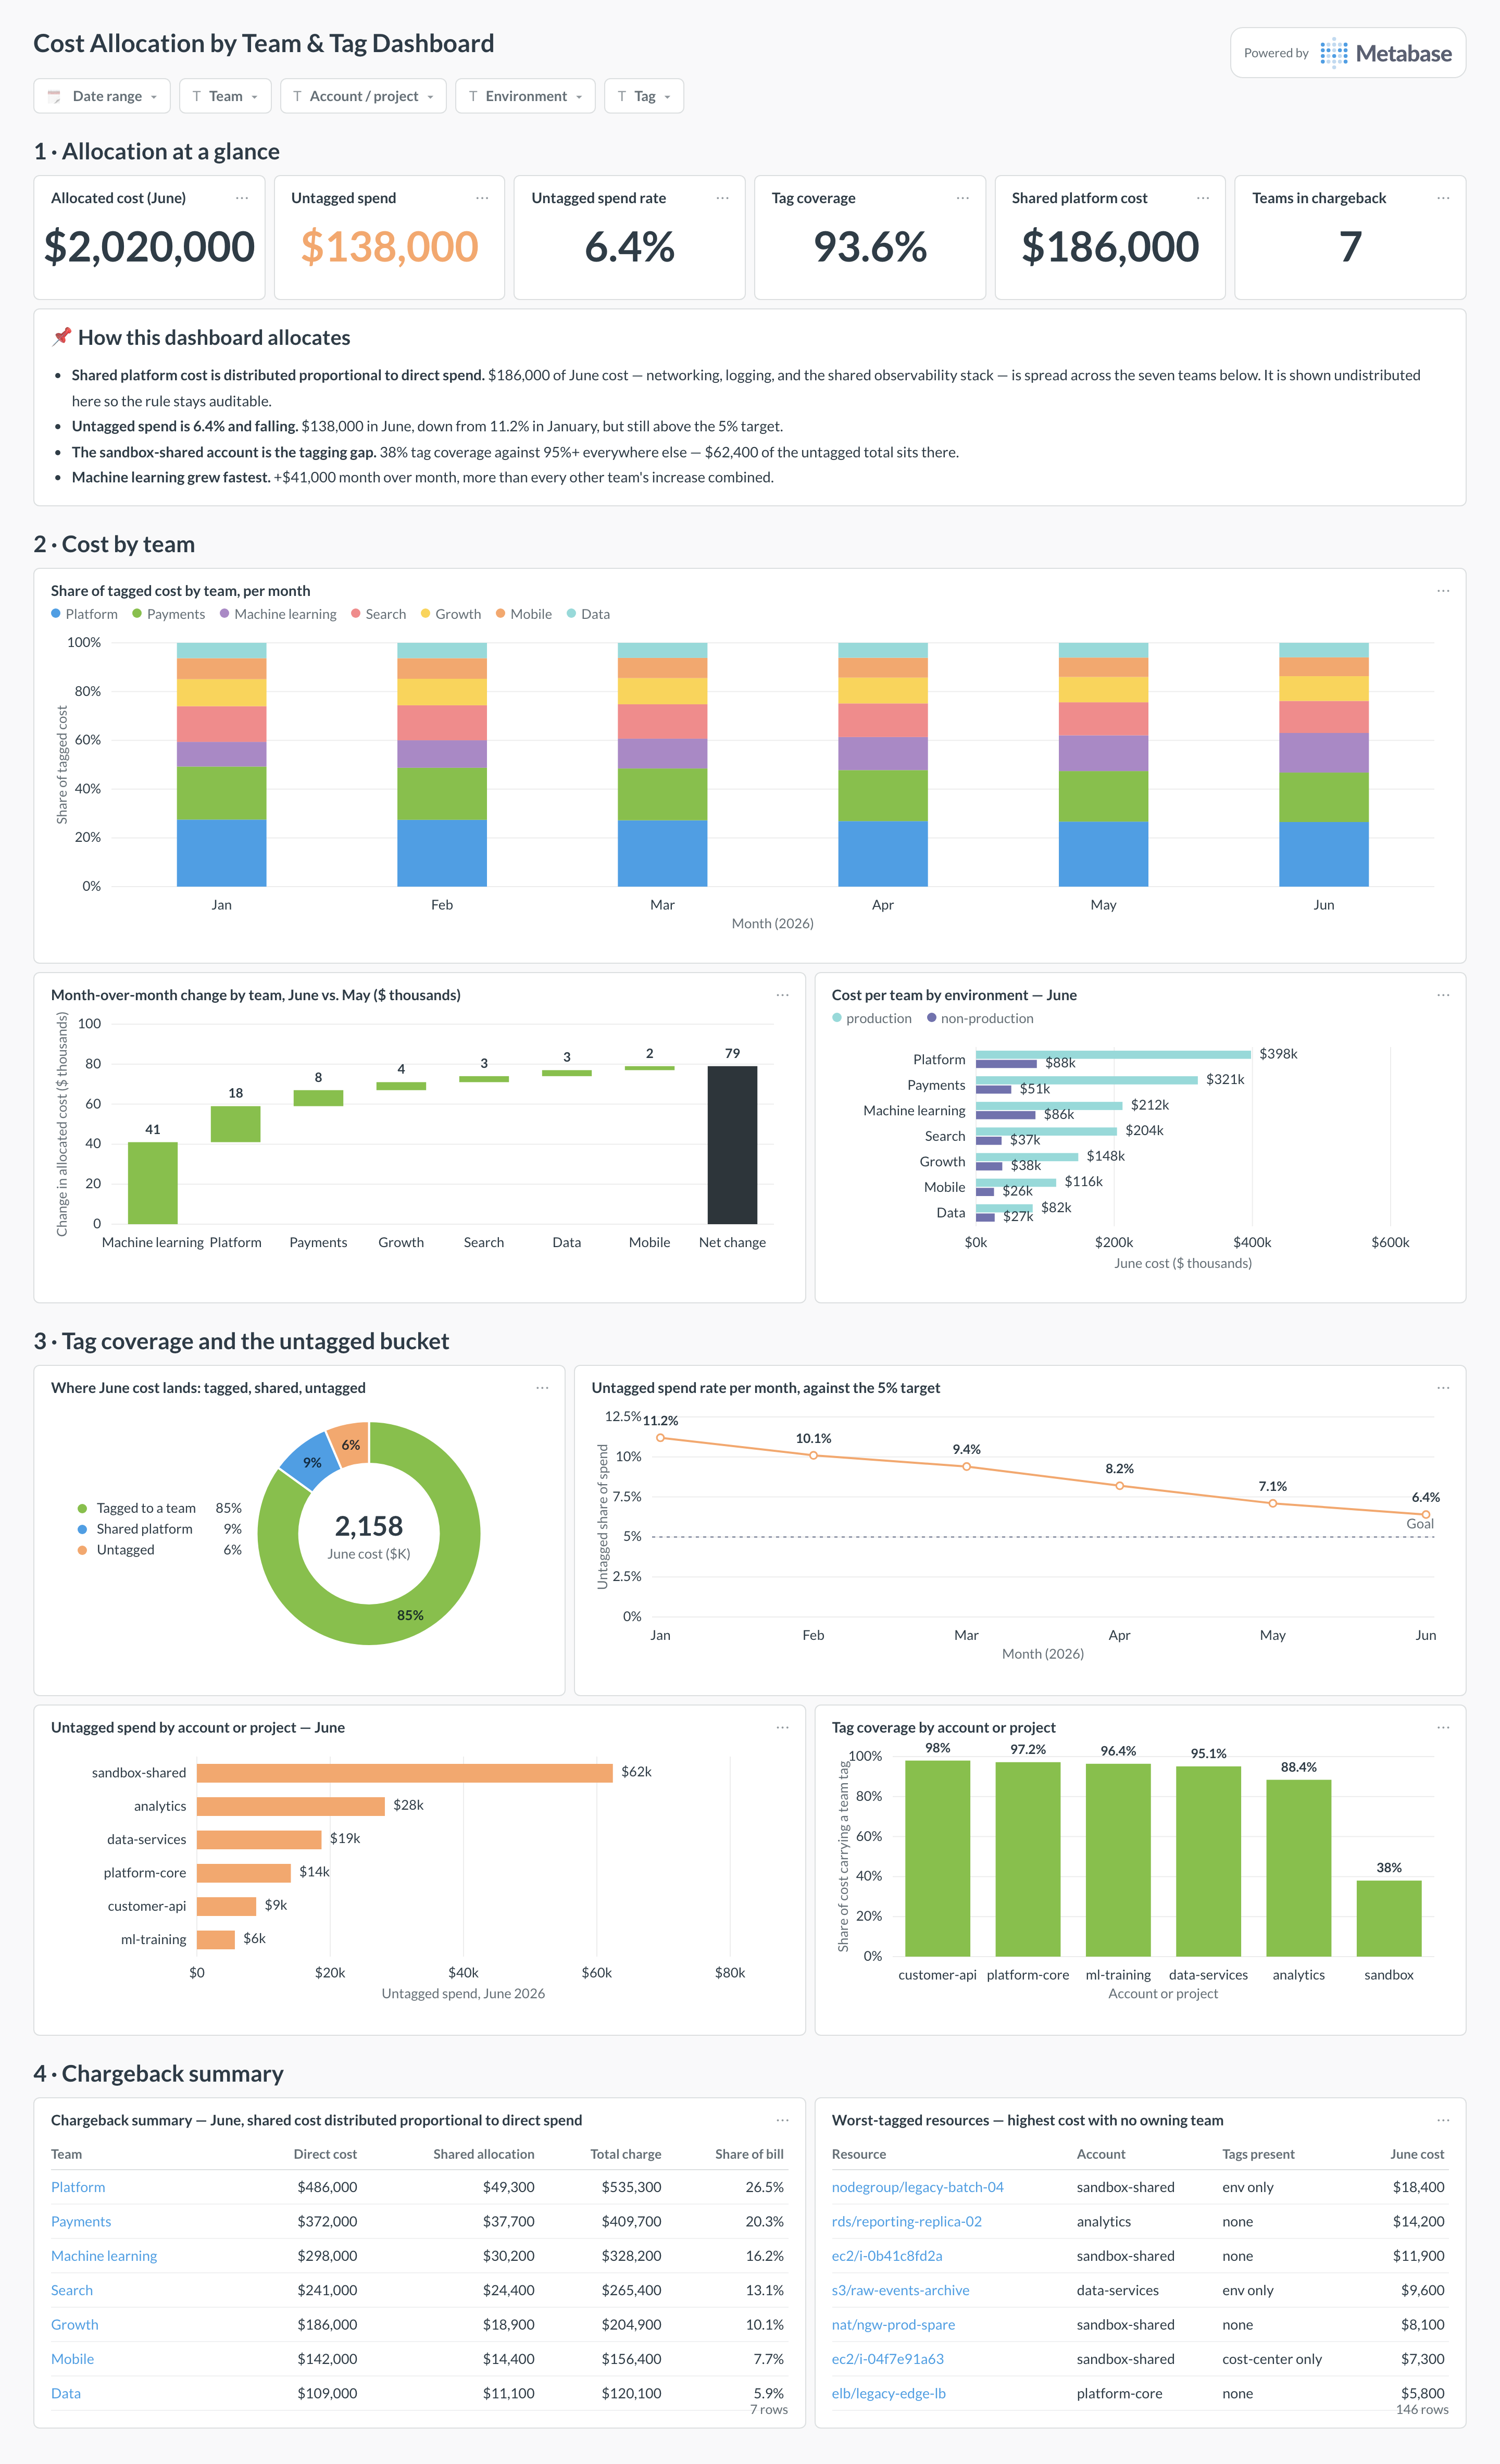
The layout moves from team shares and month-over-month change, through tag coverage and the untagged bucket, to the chargeback table — read it before sending chargeback numbers to finance.
Which cards belong on this dashboard?
- Cost by team tag by month
- Untagged spend rate and its trend
- Top untagged resources by cost
- Shared and platform cost, with the distribution rule stated
- Cost per team per environment
- Teams with the fastest month-over-month growth
- Tag coverage by account or project
- Chargeback or showback summary table
What data does this dashboard need?
- Billing line items or rollups with tags and labels preserved
- A maintained tag-to-team mapping (tags drift; the mapping is the model)
- A documented shared-cost distribution rule
- Environment tags separating production from non-production
- History-aware tagging: labels only apply from when they were added
How do you build it?
- Land billing exports or cost-platform data in a database and keep raw line items, tags, timestamps, and pricing models.
- Build rollup models at the grain this dashboard needs, with cost conventions (amortized, unblended, net) as explicit columns.
- Create one saved question per card and certify the shared models and definitions.
- Add dashboard filters for Date range, team, account or project, environment, tag.
- Show data freshness — billing exports lag, and every viewer should see by how much.
Example card SQL
Cost by team with an explicit untagged bucketPostgreSQL
SELECT
  date_trunc('month', usage_date) AS month,
  COALESCE(team, 'untagged') AS team,
  ROUND(SUM(amortized_cost_usd), 2) AS cost,
  ROUND(
    100.0 * SUM(amortized_cost_usd)
    / NULLIF(SUM(SUM(amortized_cost_usd)) OVER (
        PARTITION BY date_trunc('month', usage_date)
      ), 0), 1
  ) AS share_pct
FROM cost_daily_rollups
GROUP BY 1, 2
ORDER BY 1, cost DESC;
Related
Dashboards
Integrations
Metrics
Analytics
FAQ
How should shared costs be distributed?
By an explicit, documented rule — evenly, proportional to direct spend, or by usage. Each rule changes team totals, so state the rule on the dashboard and keep shared cost visible as its own line before distribution.
What's a good untagged spend rate?
Mature FinOps teams hold it under 5–10% of spend. Above that, allocation dashboards are guesses. Trend it, assign the biggest untagged resources an owner, and enforce tagging in provisioning rather than after the fact.