





What goes in a Kubernetes cost dashboard?
A Kubernetes cost dashboard breaks cluster spend down to namespaces, workloads, and teams — including the idle capacity and unallocated shared cost that most views quietly omit. Build it on daily allocation rollups from Kubecost or OpenCost landed in your warehouse.
For: Platform engineering, team leads, and FinOps. Refresh: daily.Source: modeled billing and cost tables in a Metabase-connected database.
What does this dashboard look like?
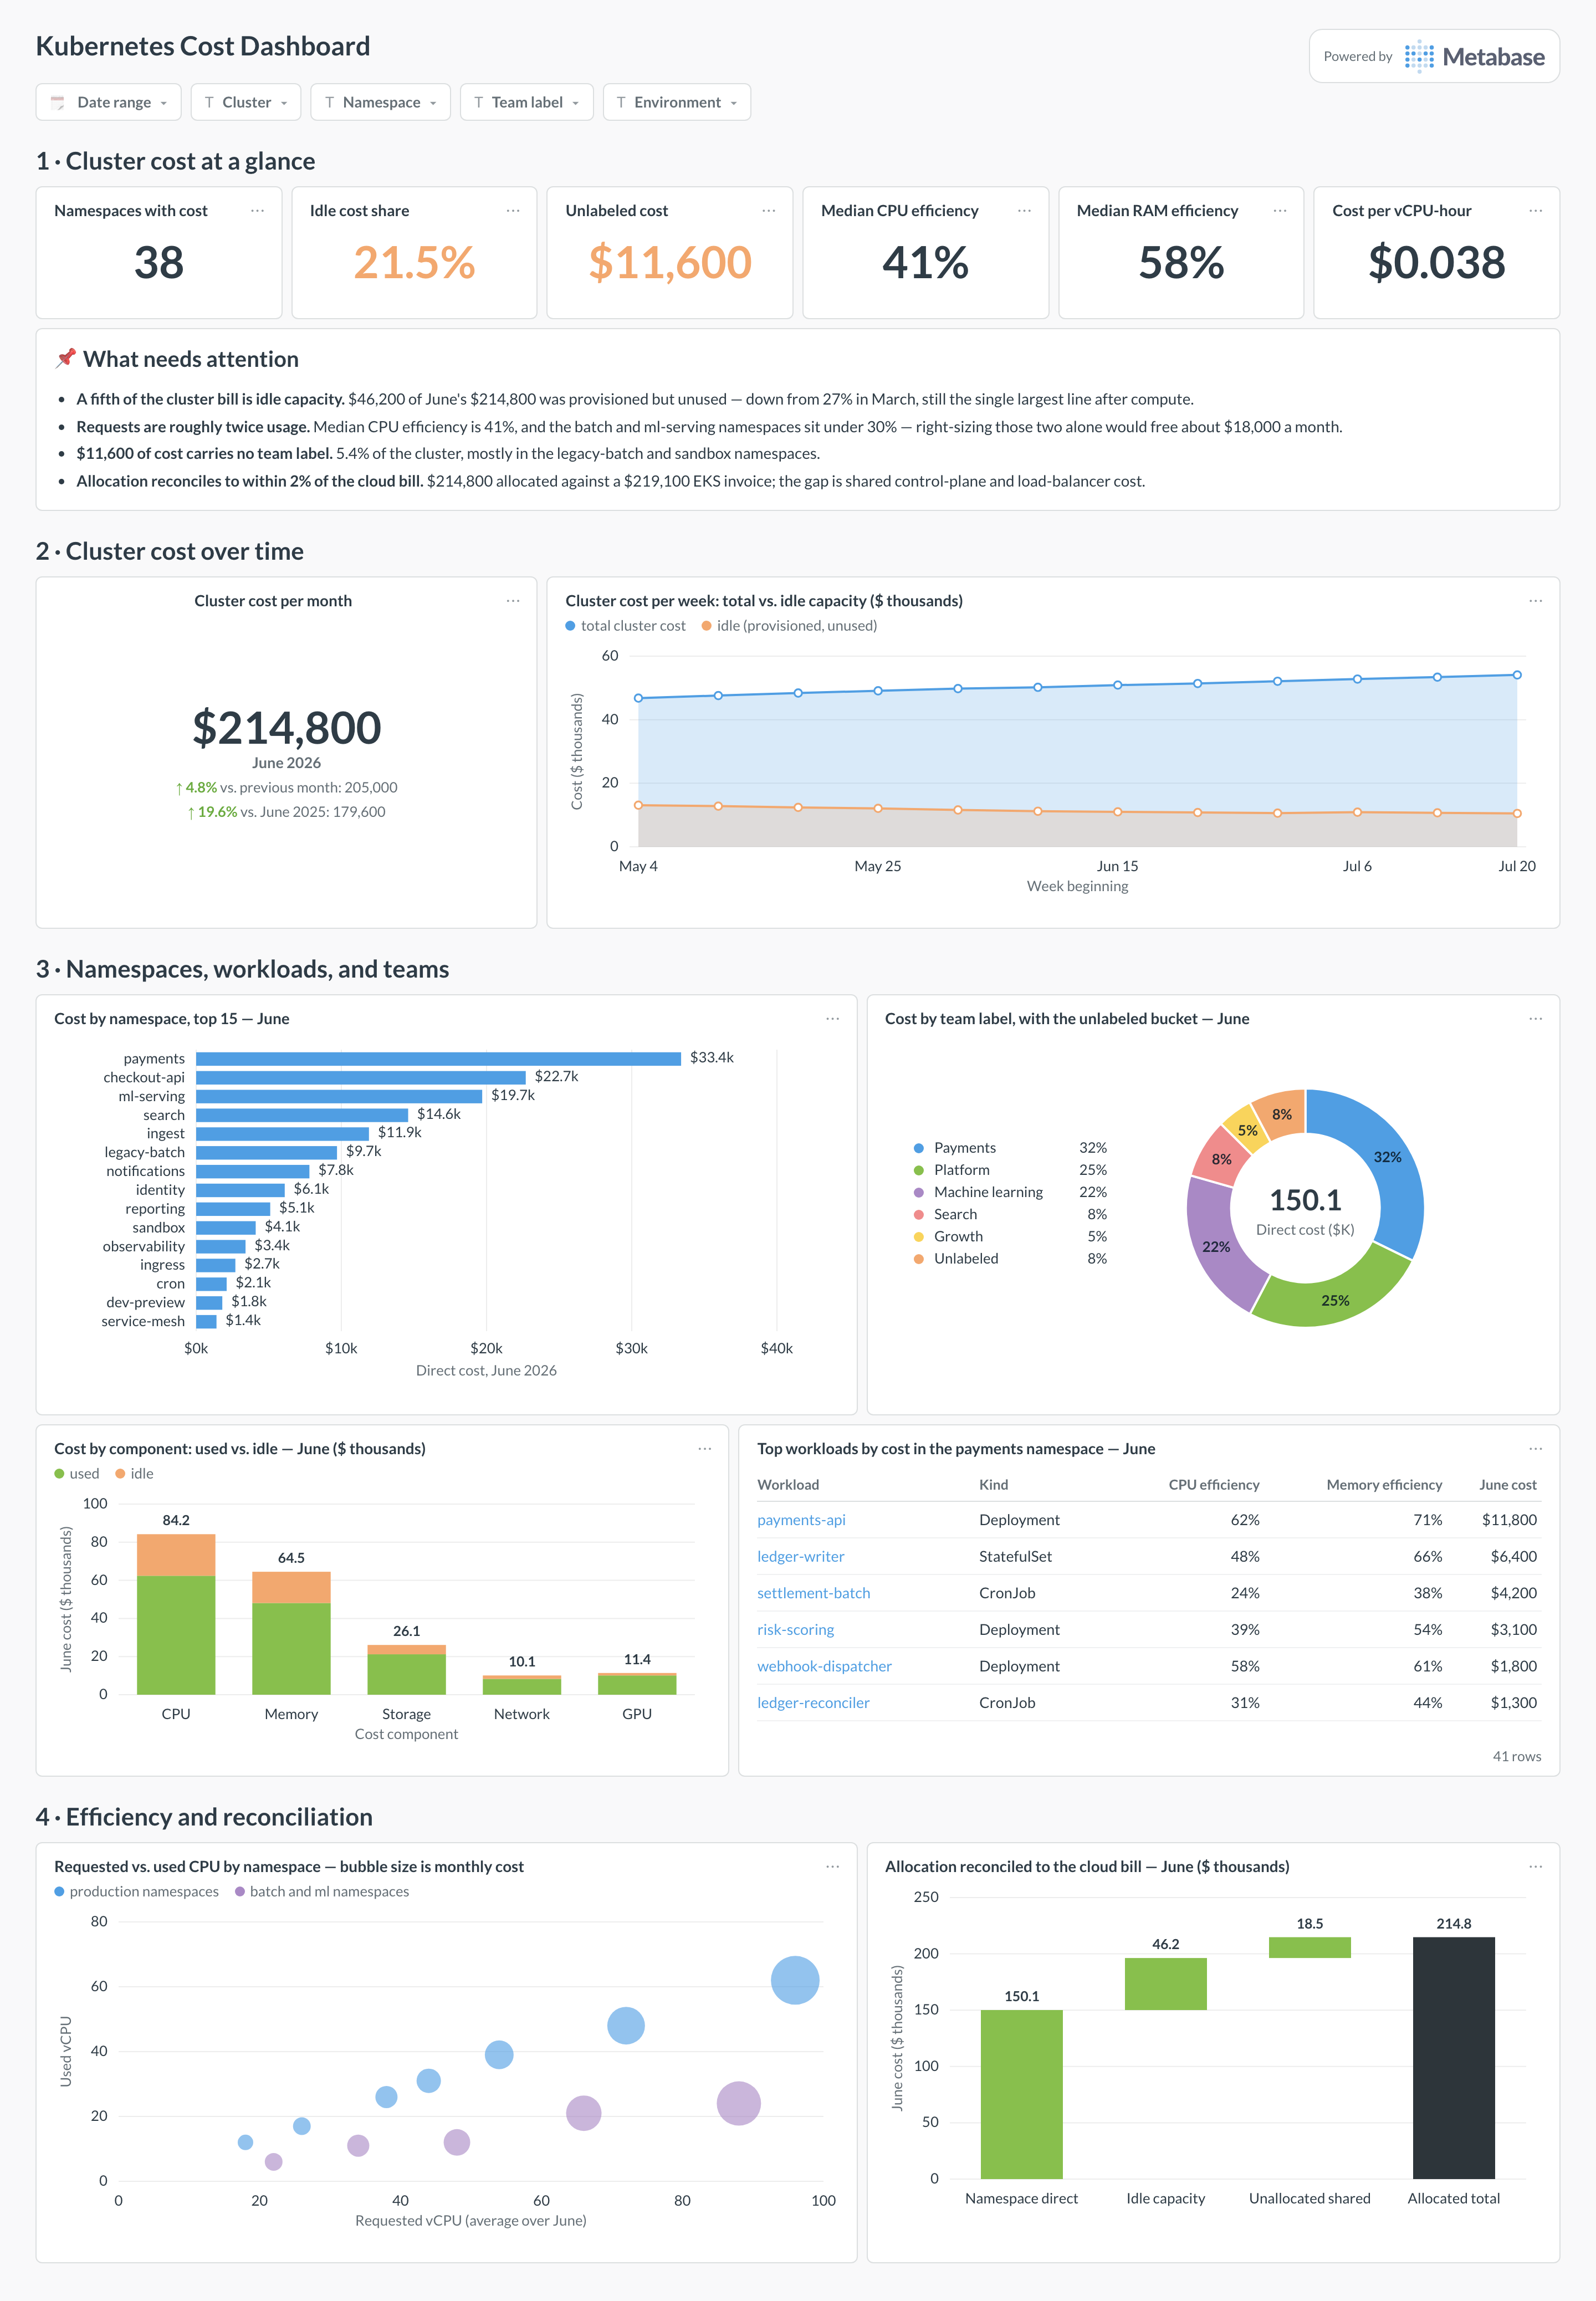
The layout runs from cluster cost and idle capacity, through namespace, workload and team breakdowns, to request-versus-usage efficiency and the reconciliation to the cloud bill.
Which cards belong on this dashboard?
- Cluster cost this month and month-over-month change
- Cost by namespace, top 15
- Cost by workload within a selected namespace
- Idle cost share and its trend
- CPU vs. memory vs. storage vs. network cost split
- Efficiency by namespace (used vs. requested)
- Cost by team label, with the unlabeled bucket visible
- Cluster cost reconciled against the cloud bill
What data does this dashboard need?
- Daily allocation rollups per namespace and workload (Kubecost/OpenCost Allocation API)
- Cost components: CPU, memory, storage, network, GPU where present
- Idle and unallocated cost broken out explicitly
- Efficiency (usage vs. request) per workload
- Label-to-team mapping for allocation views
How do you build it?
- Land billing exports or cost-platform data in a database and keep raw line items, tags, timestamps, and pricing models.
- Build rollup models at the grain this dashboard needs, with cost conventions (amortized, unblended, net) as explicit columns.
- Create one saved question per card and certify the shared models and definitions.
- Add dashboard filters for Date range, cluster, namespace, team label, environment.
- Show data freshness — billing exports lag, and every viewer should see by how much.
Example card SQL
Namespace cost with idle share, trailing 30 daysPostgreSQL
SELECT
  namespace,
  ROUND(SUM(cpu_cost + ram_cost + pv_cost + network_cost), 2) AS direct_cost,
  ROUND(SUM(idle_cost), 2) AS idle_cost,
  ROUND(
    100.0 * SUM(idle_cost)
    / NULLIF(SUM(cpu_cost + ram_cost + pv_cost + network_cost + idle_cost), 0),
    1
  ) AS idle_share_pct
FROM k8s_allocation_rollups
WHERE window_start >= CURRENT_DATE - INTERVAL '30 days'
GROUP BY namespace
ORDER BY direct_cost DESC;
Related
Dashboards
Integrations
Metrics
Analytics
FAQ
Why doesn't my namespace total match the cloud bill?
Allocation distributes measured usage over assumptions — node pricing, shared resources, and idle capacity. Add idle and unallocated cost back in and reconcile monthly against the provider's billing export; a small gap is normal, a growing one isn't.
Do I need Kubecost, or is OpenCost enough?
Both expose the same Allocation API shape this dashboard is built on. OpenCost (CNCF) covers single-cluster allocation and is free; Kubecost adds multi-cluster aggregation, savings insights, and enterprise support. Start with either — the warehouse model doesn't change.